
Search Console Crawl Stats helps site owners read Google’s crawl-request history, response groupings, file types, crawl purposes, Googlebot types, and host-status signals. This guide explains what the report can establish, how to narrow a pattern carefully, and when a technical investigation is proportionate—without treating a crawl-request graph as a ranking, traffic, or index-inclusion verdict.
What the Crawl Stats report is—and is not
Search Console Crawl Stats is a historical view of requests made by Google’s crawlers to a site. It can show how many requests were made, when they occurred, the reported server response, and whether Google detected availability problems while crawling. That makes it useful for a specific operational question: “What did Googlebot request from this property during this report period, and is there evidence of a request, response, or availability pattern worth investigating?” [1]
It does not answer every SEO question. A request is not proof that a URL was selected as canonical, processed for indexing, shown in a result, or useful to a reader. Conversely, an individual URL’s absence from a selected Crawl Stats breakdown does not prove that it cannot be crawled. Treat the report as a record of crawler activity with stated scope and coverage limits. It is most useful when its request-level information is combined carefully with URL Inspection, Page Indexing, logs, release notes, and public response checks.
Decide whether the report fits the question
Google describes Crawl Stats as an advanced report and recommends it particularly for sites with a thousand pages or more. That is a useful starting point, not a rule that smaller sites must ignore. A smaller site may use the report when there is a real availability warning, an unexplained response pattern, a migration check, or a material change in crawl requests. It is not necessary to open the report merely to create a weekly SEO ritual. [1]
Begin by writing a narrow question. For example: “Did Googlebot encounter an availability issue during the interval in which the host reported a timeout?” or “Which response group explains the rise in requests after a documented redirect release?” These questions name a time, observed condition, and next source of evidence. By contrast, “why is traffic down?” asks the Crawl Stats report to answer a performance question it was not designed to settle. Separate crawl history from search-performance measures before starting analysis.
Confirm property scope before reading a chart
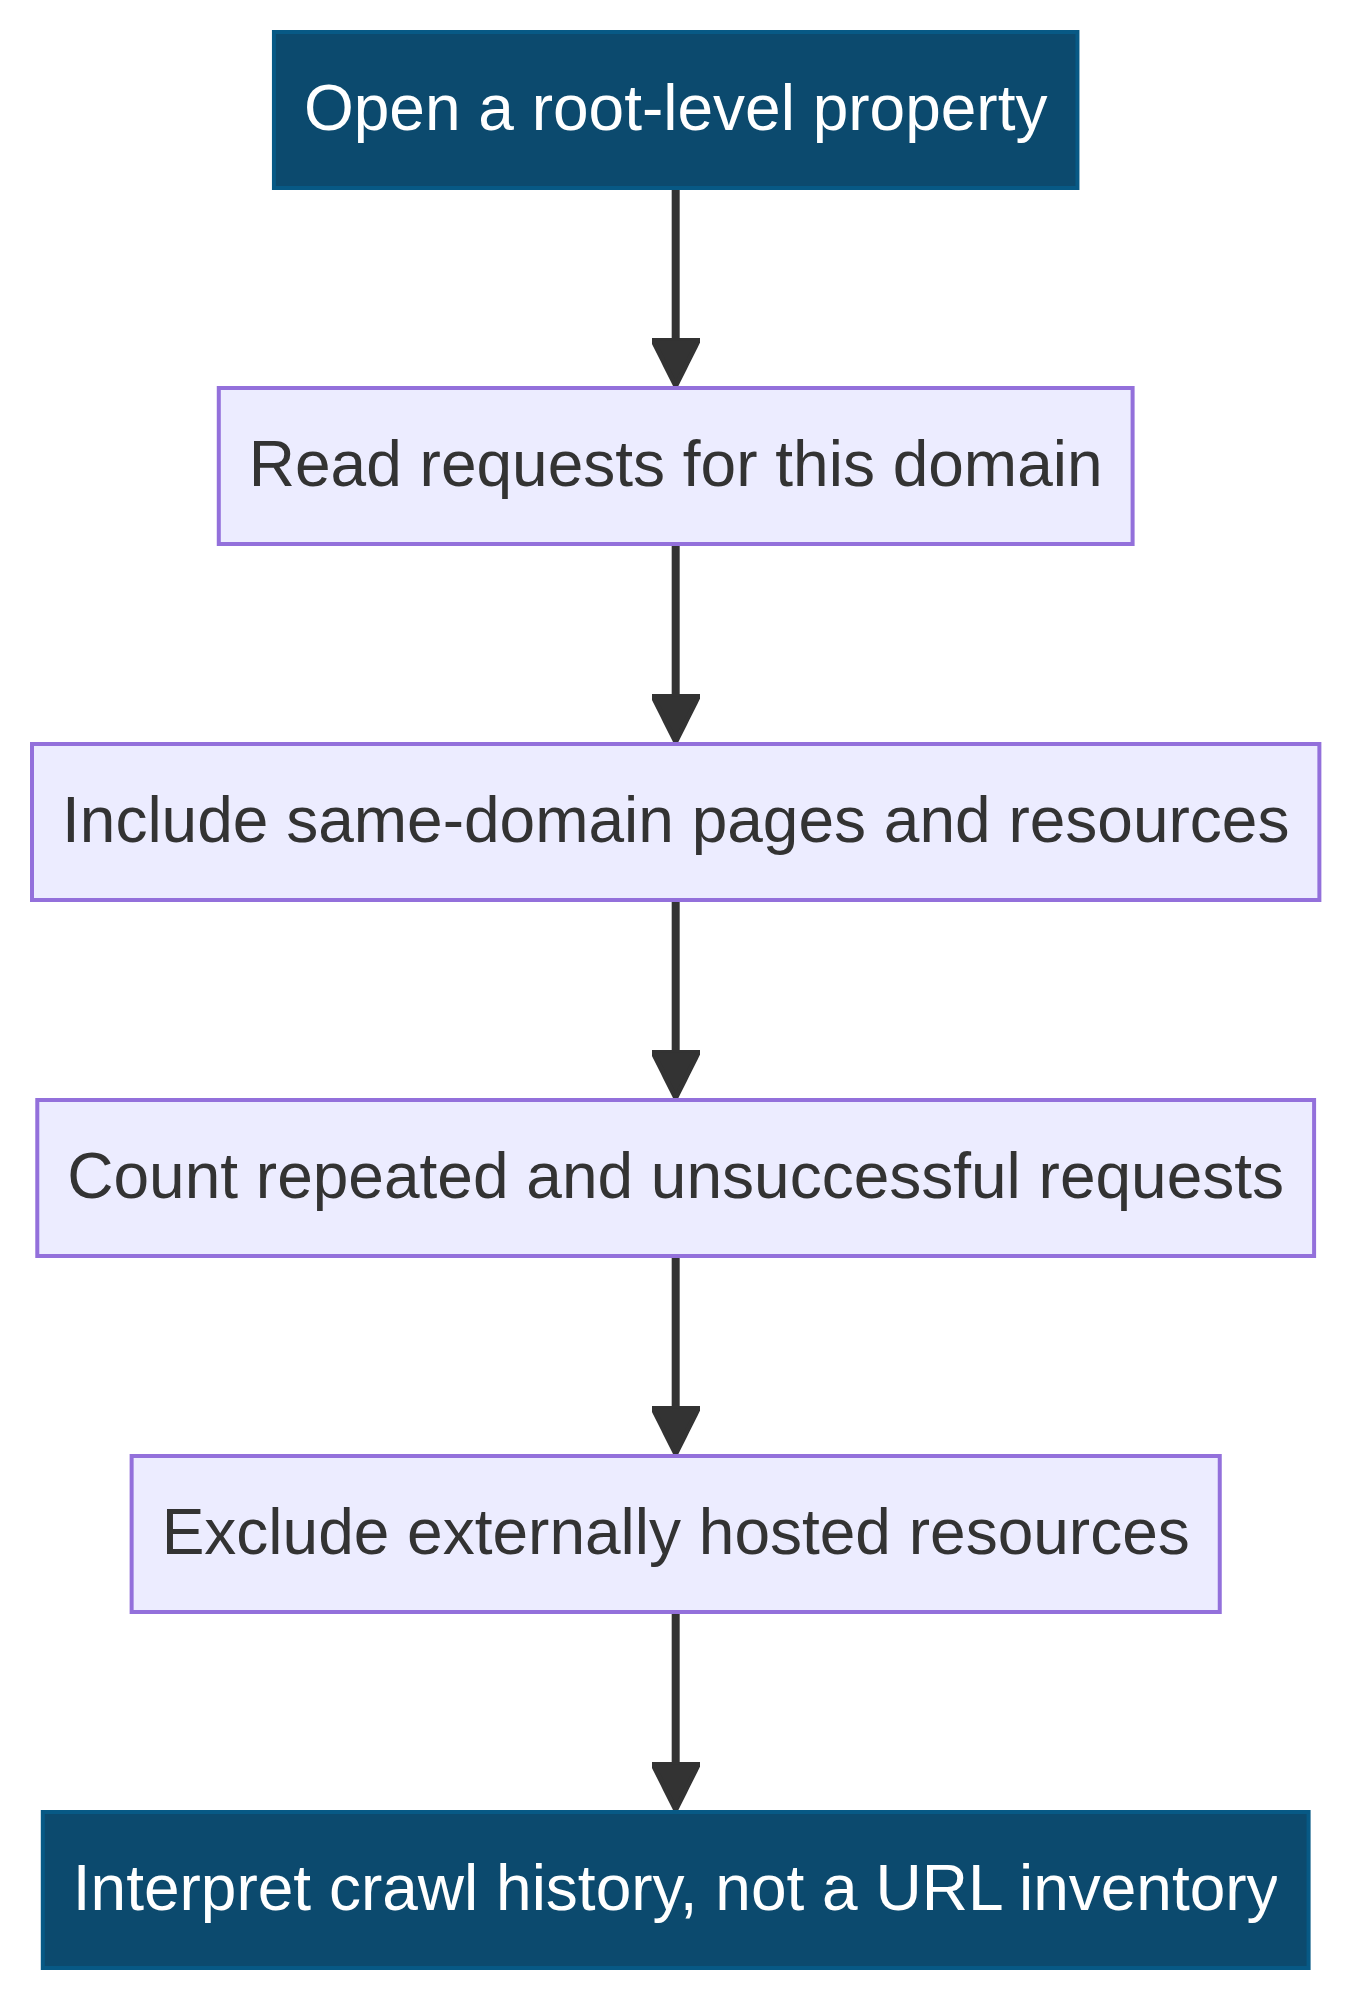
Crawl Stats is available only for root-level properties: a Domain property or a URL-prefix property at the root, such as https://example.com. The report’s scope matters because it includes both HTTP and HTTPS requests, even for a URL-prefix property, while its example URLs are limited to the property protocol. A Domain property can show requests across subdomains, whereas a child URL-prefix property has a narrower view. [1]
Resources hosted outside the selected domain are not counted. If a page loads an image, font, script, or other resource from a separate host, that external request belongs to the host that served it, not to the site’s Crawl Stats report. This prevents a common mistake: interpreting a low resource count as evidence that a page had no external dependencies. Write the selected property in any audit note so another reviewer can understand what the report could and could not show.
Understand what a crawl request count represents
The total-request chart counts requests to URLs on the property, including repeated requests to the same URL. It also includes unsuccessful attempts, such as a request that could not proceed because robots.txt was unavailable, DNS resolution failed, server connectivity failed, or a redirect loop interrupted the request. The total is therefore an activity measure, not a count of distinct useful pages. [1]
That distinction affects how a team describes a change. A higher request total can reflect repeated checks, resources, redirects, site changes, or crawler behavior; it does not automatically establish a positive or negative search outcome. A lower total can reflect ordinary demand variation, a quieter site, a temporary availability limitation, or a report boundary. The responsible next question is not “is this number good?” but “what grouping, time interval, and independent evidence would make the change intelligible?”
Keep crawl requests separate from indexed URLs
Crawl Stats lists the actual URLs requested by Google. Google states that the report does not assign data to canonical URLs. This means a requested parameter URL, a redirected URL, a duplicate variant, or a resource URL can appear even when the page a team considers canonical is different. A report table should therefore retain the original requested URL instead of silently mapping every request to a preferred destination. [1]
When the question is whether a particular page is eligible for Google Search, use the appropriate evidence for that question. The Search Console indexing triage guide covers Page Indexing and URL Inspection as separate tools. Crawl Stats can provide surrounding context—for example, a reported request or availability period—but it does not replace URL-level inspection. This separation protects against a common overreach: calling a crawl event an indexation diagnosis without verifying the page itself.
Read the overview before selecting a grouping
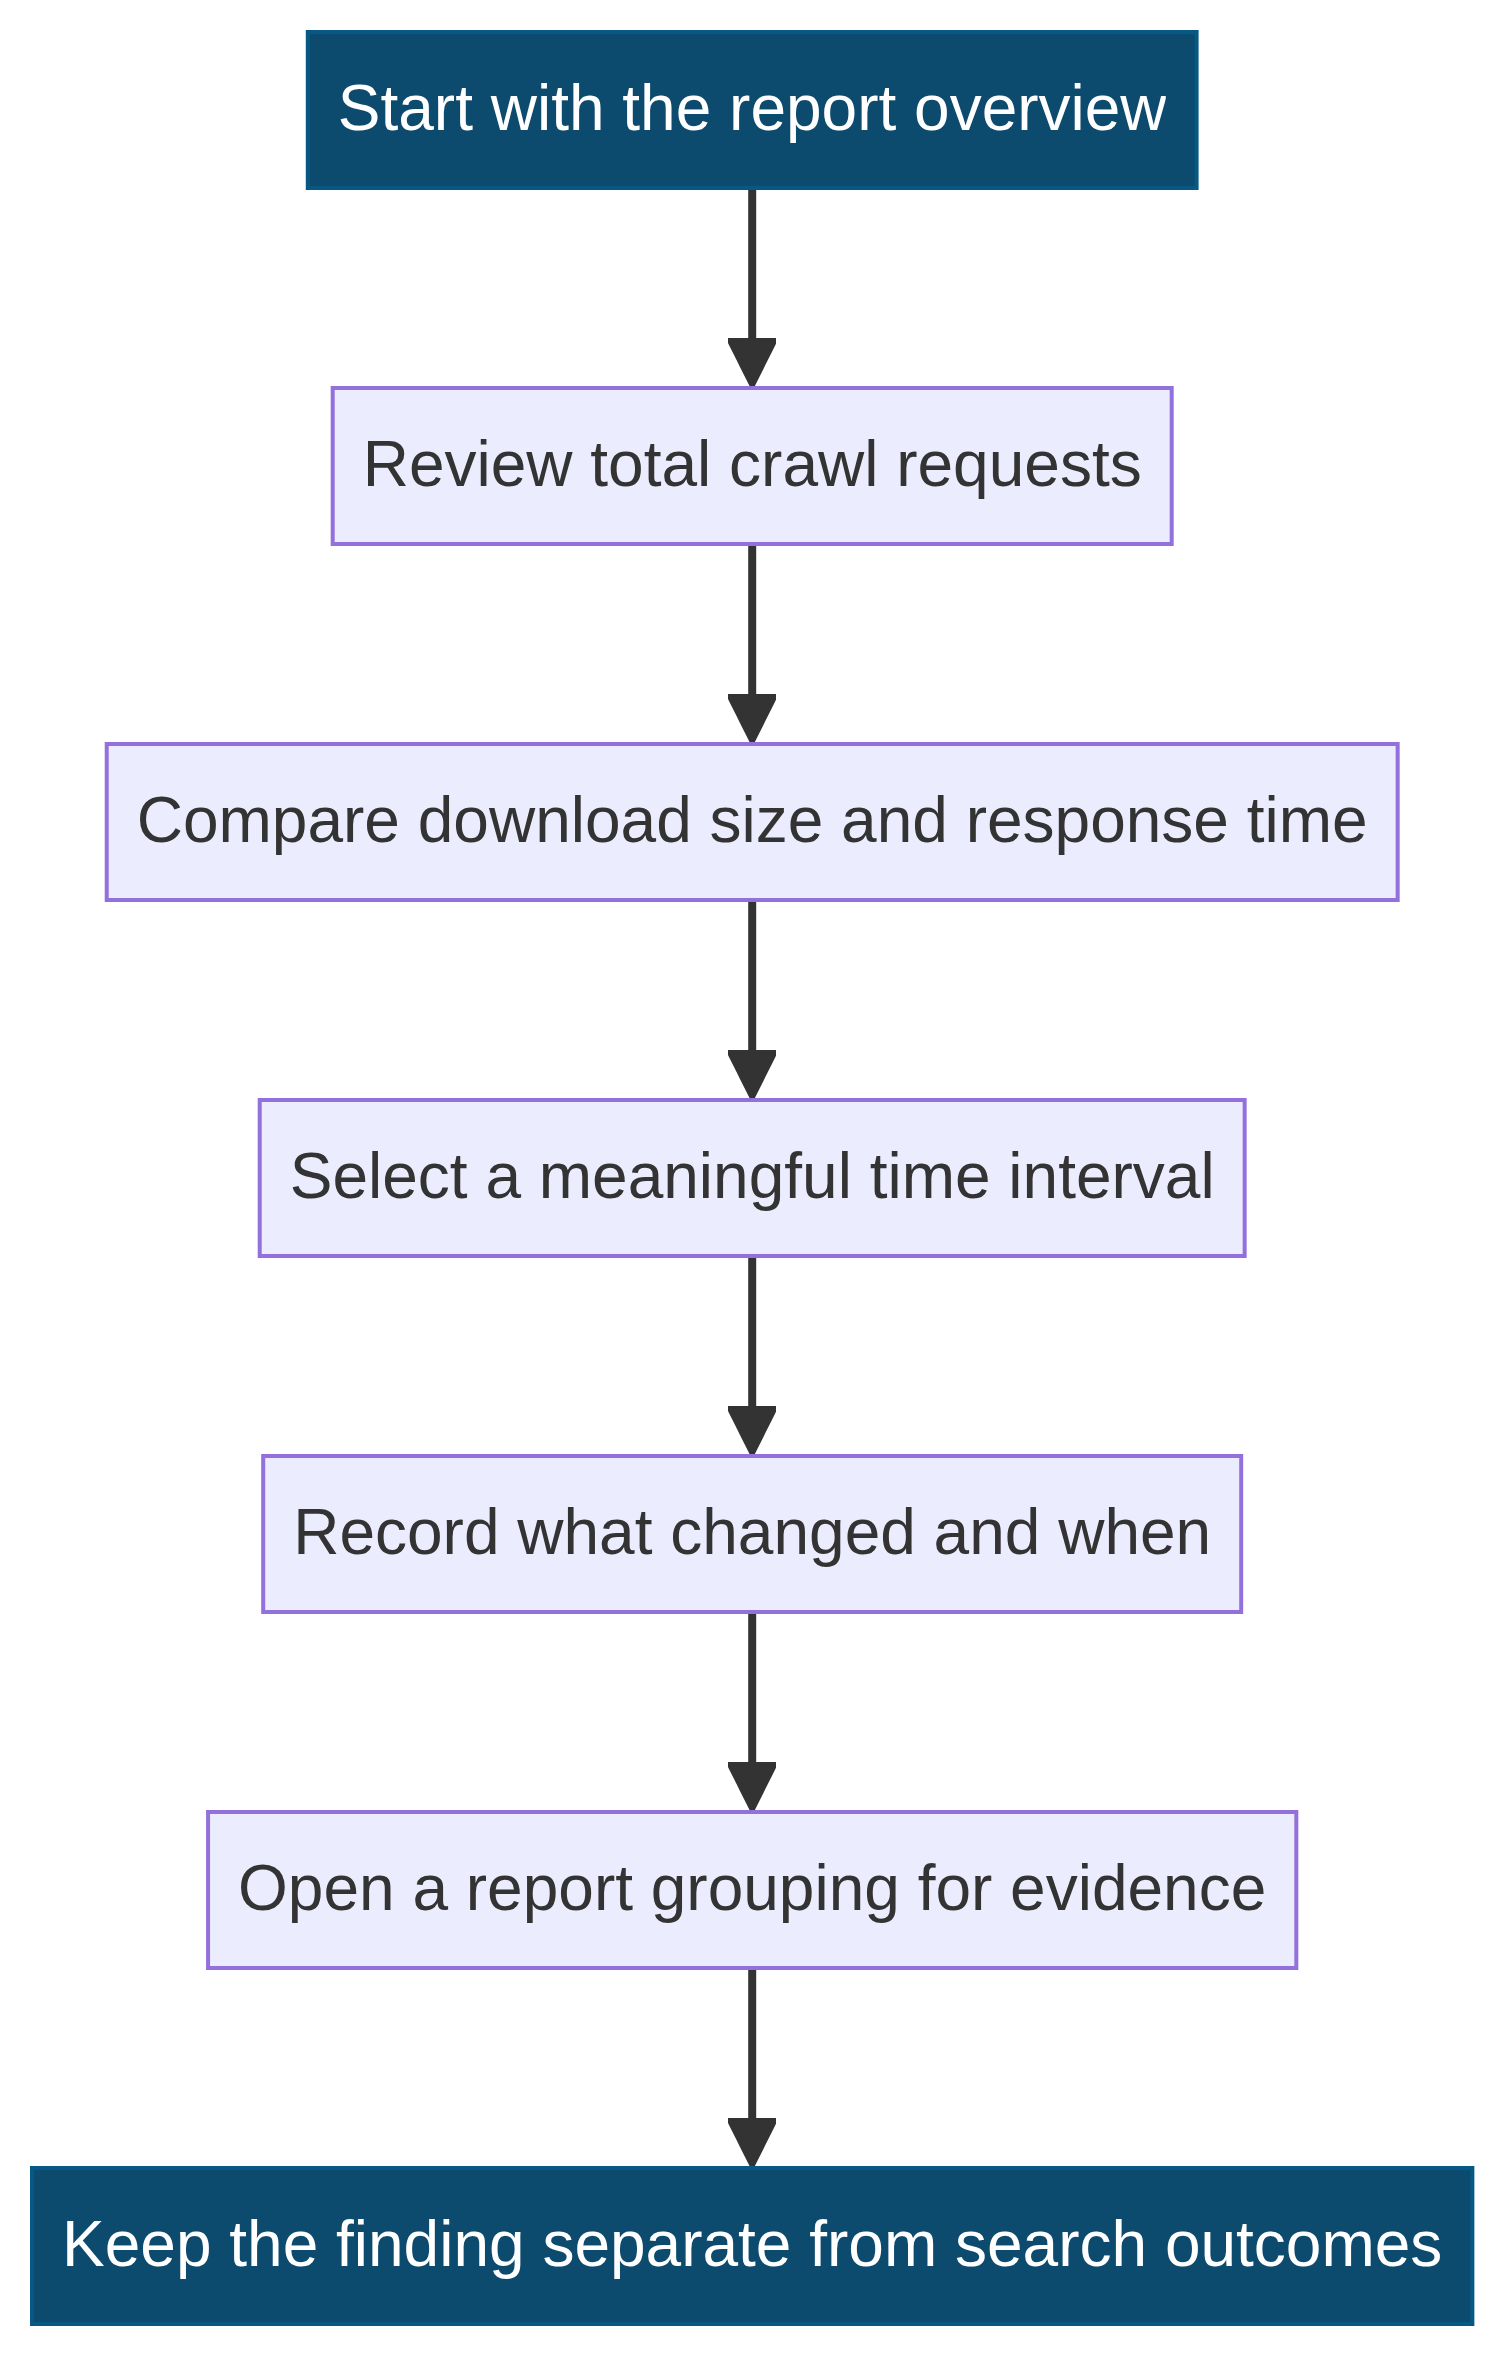
The report begins with three overview charts: total crawl requests, total download size, and average response time. Use them to notice a dated pattern, not to impose a universal target. A sharp change can be a reason to look closer when it aligns with a documented deployment, an outage record, a site move, or a noticeable change in the URL inventory. Without that context, an isolated rise or drop is only an observation. [1]
Choose a time interval that makes sense for the question and record it. If the report was checked after a short incident, compare that bounded interval with a nearby normal interval. If the site has a release log, place the release dates alongside the observation without claiming causation. Then open the grouping that can provide more detail. The goal is to move from a broad chart to checkable evidence, rather than to build a confident story from a line alone.
Use download size and response time carefully
Download size and average response time describe reported crawler-request conditions, not a complete user-experience score. A file-type shift can change download totals without any change to HTML pages. A response-time change can be meaningful when it is sustained, corroborated by host monitoring, and aligned with affected requests, but a single chart movement does not identify an application, database, CDN, or template cause. Start by checking the interval and grouping. [1]
Avoid turning the average response-time chart into a benchmark contest. Google’s crawling guidance focuses on availability, capacity, and efficient delivery where there is a real crawl need. A team should investigate material, evidence-supported conditions rather than make risky infrastructure changes solely to lower a reported average. If a pattern is not tied to observed availability, important URLs, or a documented technical event, record it as a monitoring observation and recheck later instead of assuming a defect. [2]
Set a timeframe before comparing patterns
A comparison needs two clearly stated intervals. Define the property, the start and end dates, the exact chart or grouping, and any relevant site events. A simple review note might say: “For the root domain property, response-group requests were reviewed for 1–7 August and compared with 8–14 August; the site released an approved redirect change on 8 August.” That makes the observation reproducible even when no cause is established.
Do not compare an incomplete day with a completed week, or attribute a gradual trend to a release that happened after the trend began. Where the report makes example URLs available, save the exact examples with the observation date. Where it does not, use a public response check, server record, or a small URL Inspection sample that matches the question. A precise interval and a small evidence packet are more useful than a large export with no decision boundary.
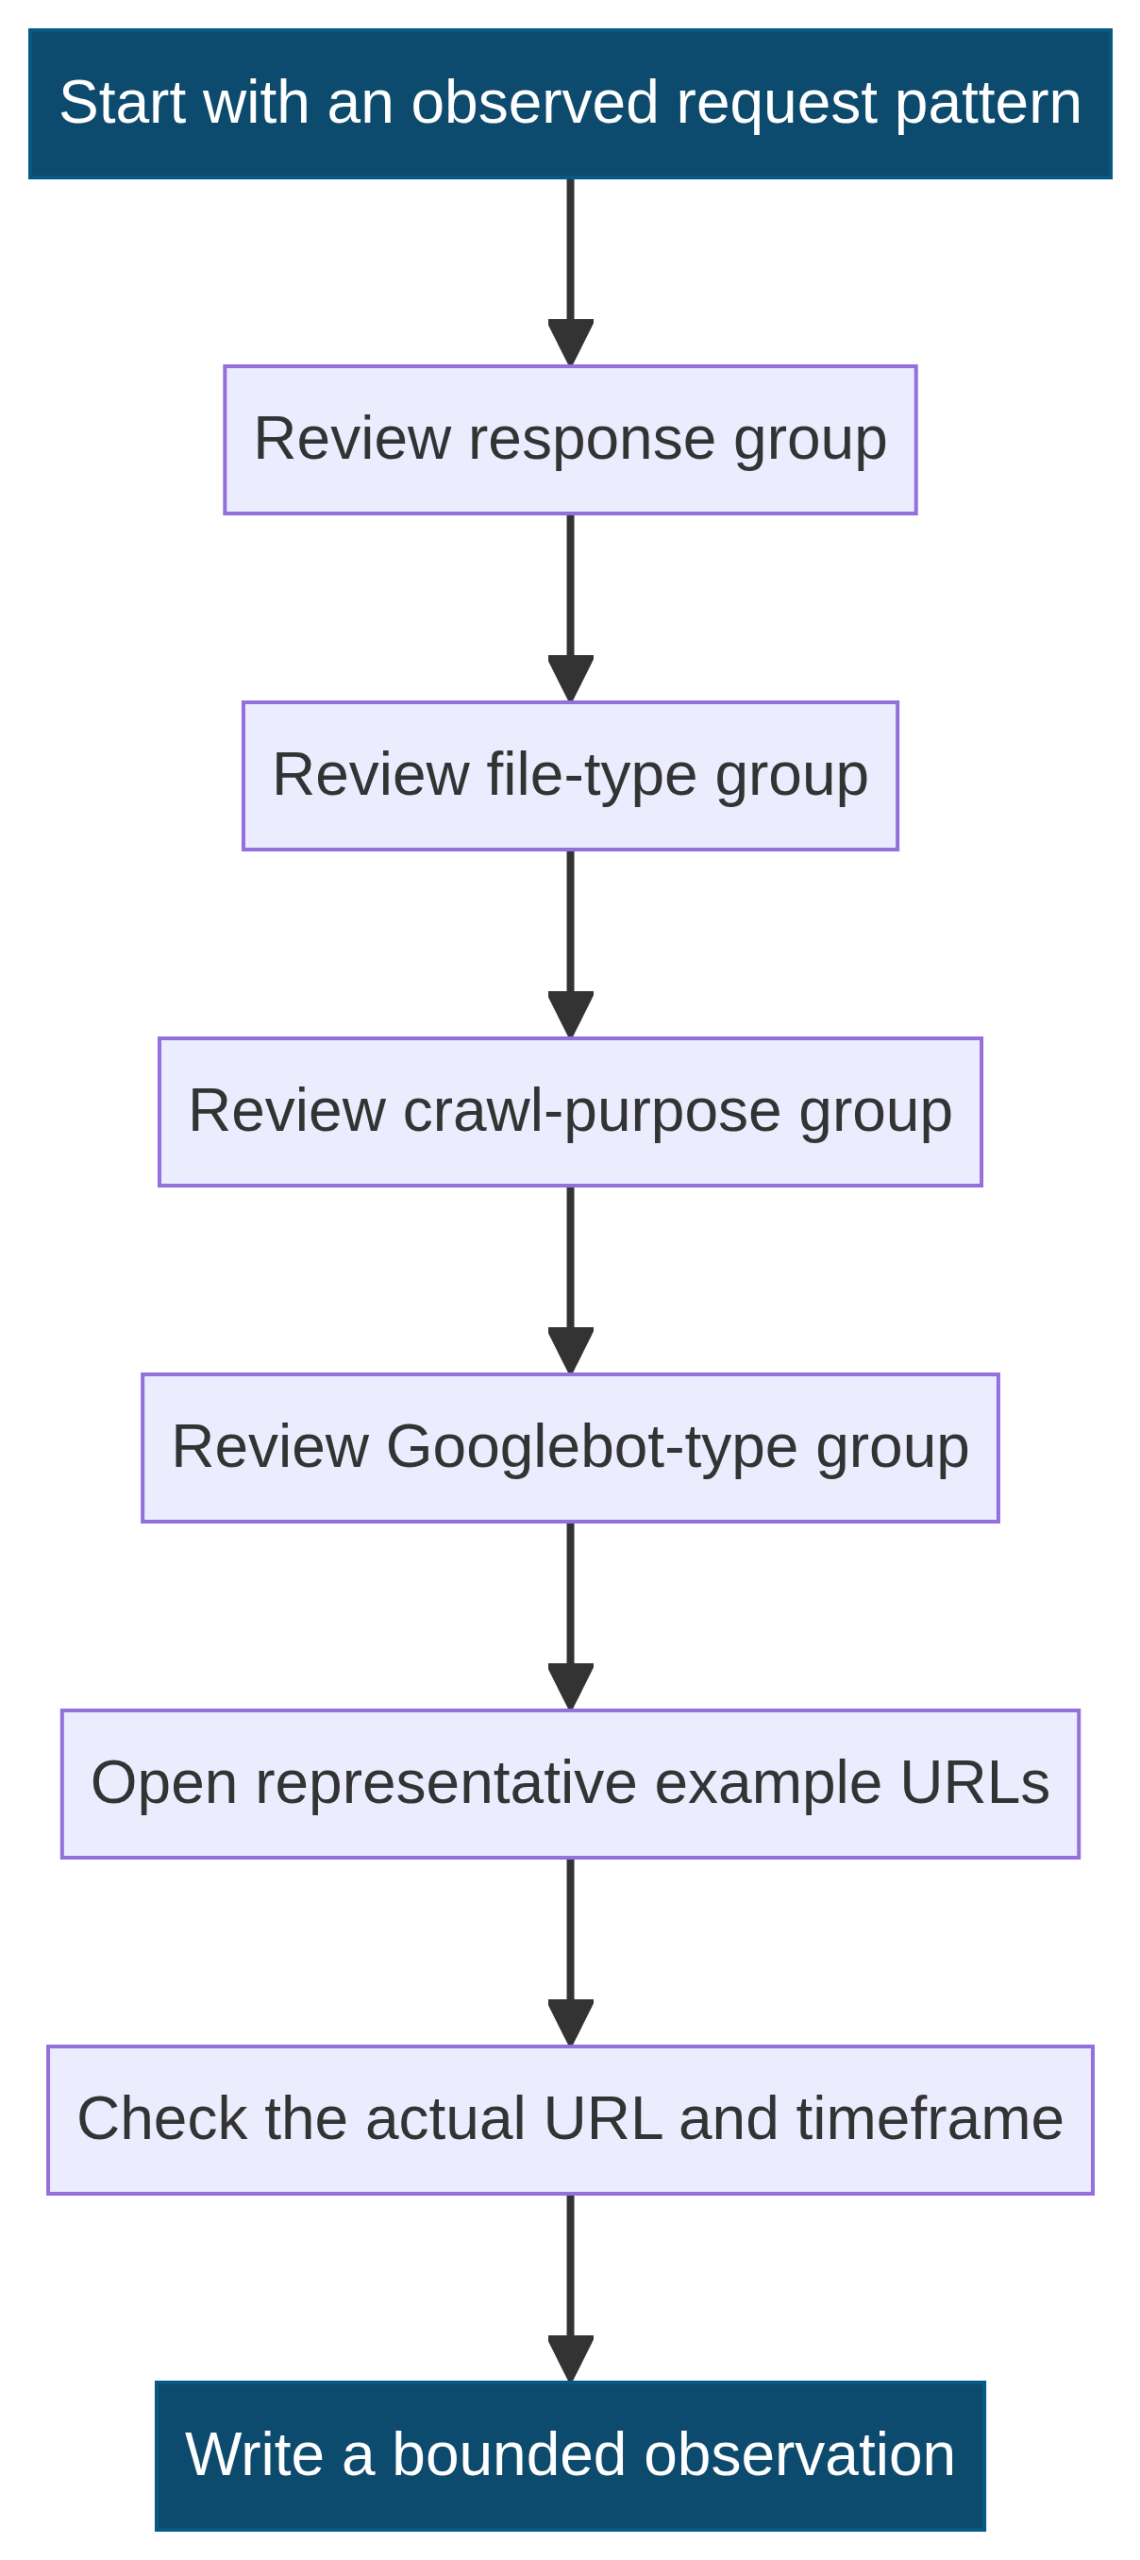
Start narrowing with the response grouping
The response grouping can show whether requests ended with success, redirects, client errors, server errors, or other reported outcomes. It should prompt code-aware investigation. A 2xx response means Google received content that can move to later processing; it does not establish the later index state for that content. A 4xx response means Google does not use the returned content, while 5xx and 429 conditions lead Google’s crawlers to slow down temporarily. [3]
For a meaningful pattern, inspect representative URLs rather than react to a percentage alone. Determine whether the URLs are intentional retired paths, current canonical pages, resources, a temporary maintenance condition, or a newly introduced behavior. This is where an owner can distinguish a healthy 404 for a permanently absent page from a 404 on a current navigation target. The report points toward the next check; the URL, its response, and the surrounding site context determine whether there is a repair to make.
Interpret redirects as request paths, not success badges
Redirect requests can be normal during a planned move or after consolidating a truthful duplicate URL. Google generally follows up to ten redirect hops for general web content, and treats permanent versus temporary redirects differently. That does not make every redirect pattern harmless. A high or rising redirect group may justify reviewing whether current internal links, sitemaps, canonical URLs, or templates still point to intermediate paths. [3]
Start with a handful of representative examples and map each one to its final response. A direct, truthful one-hop redirect from an old page to an equivalent current page may be appropriate. A long chain, loop, or redirect to an unrelated destination is a different issue. The XML sitemap governance guide is relevant only where a submitted URL or sitemap path is involved; it does not substitute for checking the request chain itself. Record the before-and-after path before changing anything.
Treat client and server errors differently
Google groups 4xx and 5xx outcomes for a reason, but their practical interpretation is different. A persistent 404 or 410 can be the correct response for content that is genuinely gone. A 401 or 403 may be expected for protected areas, but it can be a problem if a public page or required resource was accidentally restricted. A 429 signals that the server is overloaded from Google’s crawler perspective. Each condition needs an actual URL-level review. [3]
Server errors deserve particular care because Google says 5xx and 429 responses cause temporary slowing of crawling and that persistently returning server-error URLs can eventually be dropped from Google Search. That is not a reason to change a site broadly on the strength of one chart. It is a reason to identify the affected interval, inspect the real response history, check application and hosting evidence, and fix the verified availability cause. Distinguish a short contained incident from a persistent condition in the report record.
Use file type to ask a smaller question
Crawl Stats can group requests by file type. This is useful when an overview change may be driven by HTML, images, JavaScript, CSS, or another resource class. The grouping does not say that any file type is inherently good or bad. It helps a reviewer avoid assuming that every request change belongs to a page template when it might instead relate to a resource hosted on the selected property. [1]
For example, a rise in image requests is an observation to check against a real media change, same-domain image paths, and current public responses. It is not evidence that images will be displayed in a search feature. Likewise, a rise in JavaScript requests is not a rendering diagnosis by itself. Check the relevant URLs, browser behavior, and deployment record before associating a resource group with a visitor-facing or crawler-facing problem. Keep each tool’s evidence role visible.
Use crawl purpose and Googlebot type as context
Crawl purpose and Googlebot type can add useful context to a request pattern. They help explain what class of crawler activity is being reported and can prevent a team from treating all requests as identical. The report documentation lists these as separate groupings, which means their values should be preserved in any note instead of collapsed into a broad statement that “Google crawled the site.” [1]
Use the categories to narrow a question, not to infer the crawler’s future intent. A grouping does not tell an owner that a page will appear in a specific surface, that a video will receive a feature, or that a resource change caused a ranking change. If a particular URL needs to be understood, open the example, check its real response and page behavior, then decide whether Page Indexing or URL Inspection is the better next source. This keeps the report as context rather than a substitute for direct validation.
Read host status as an availability signal
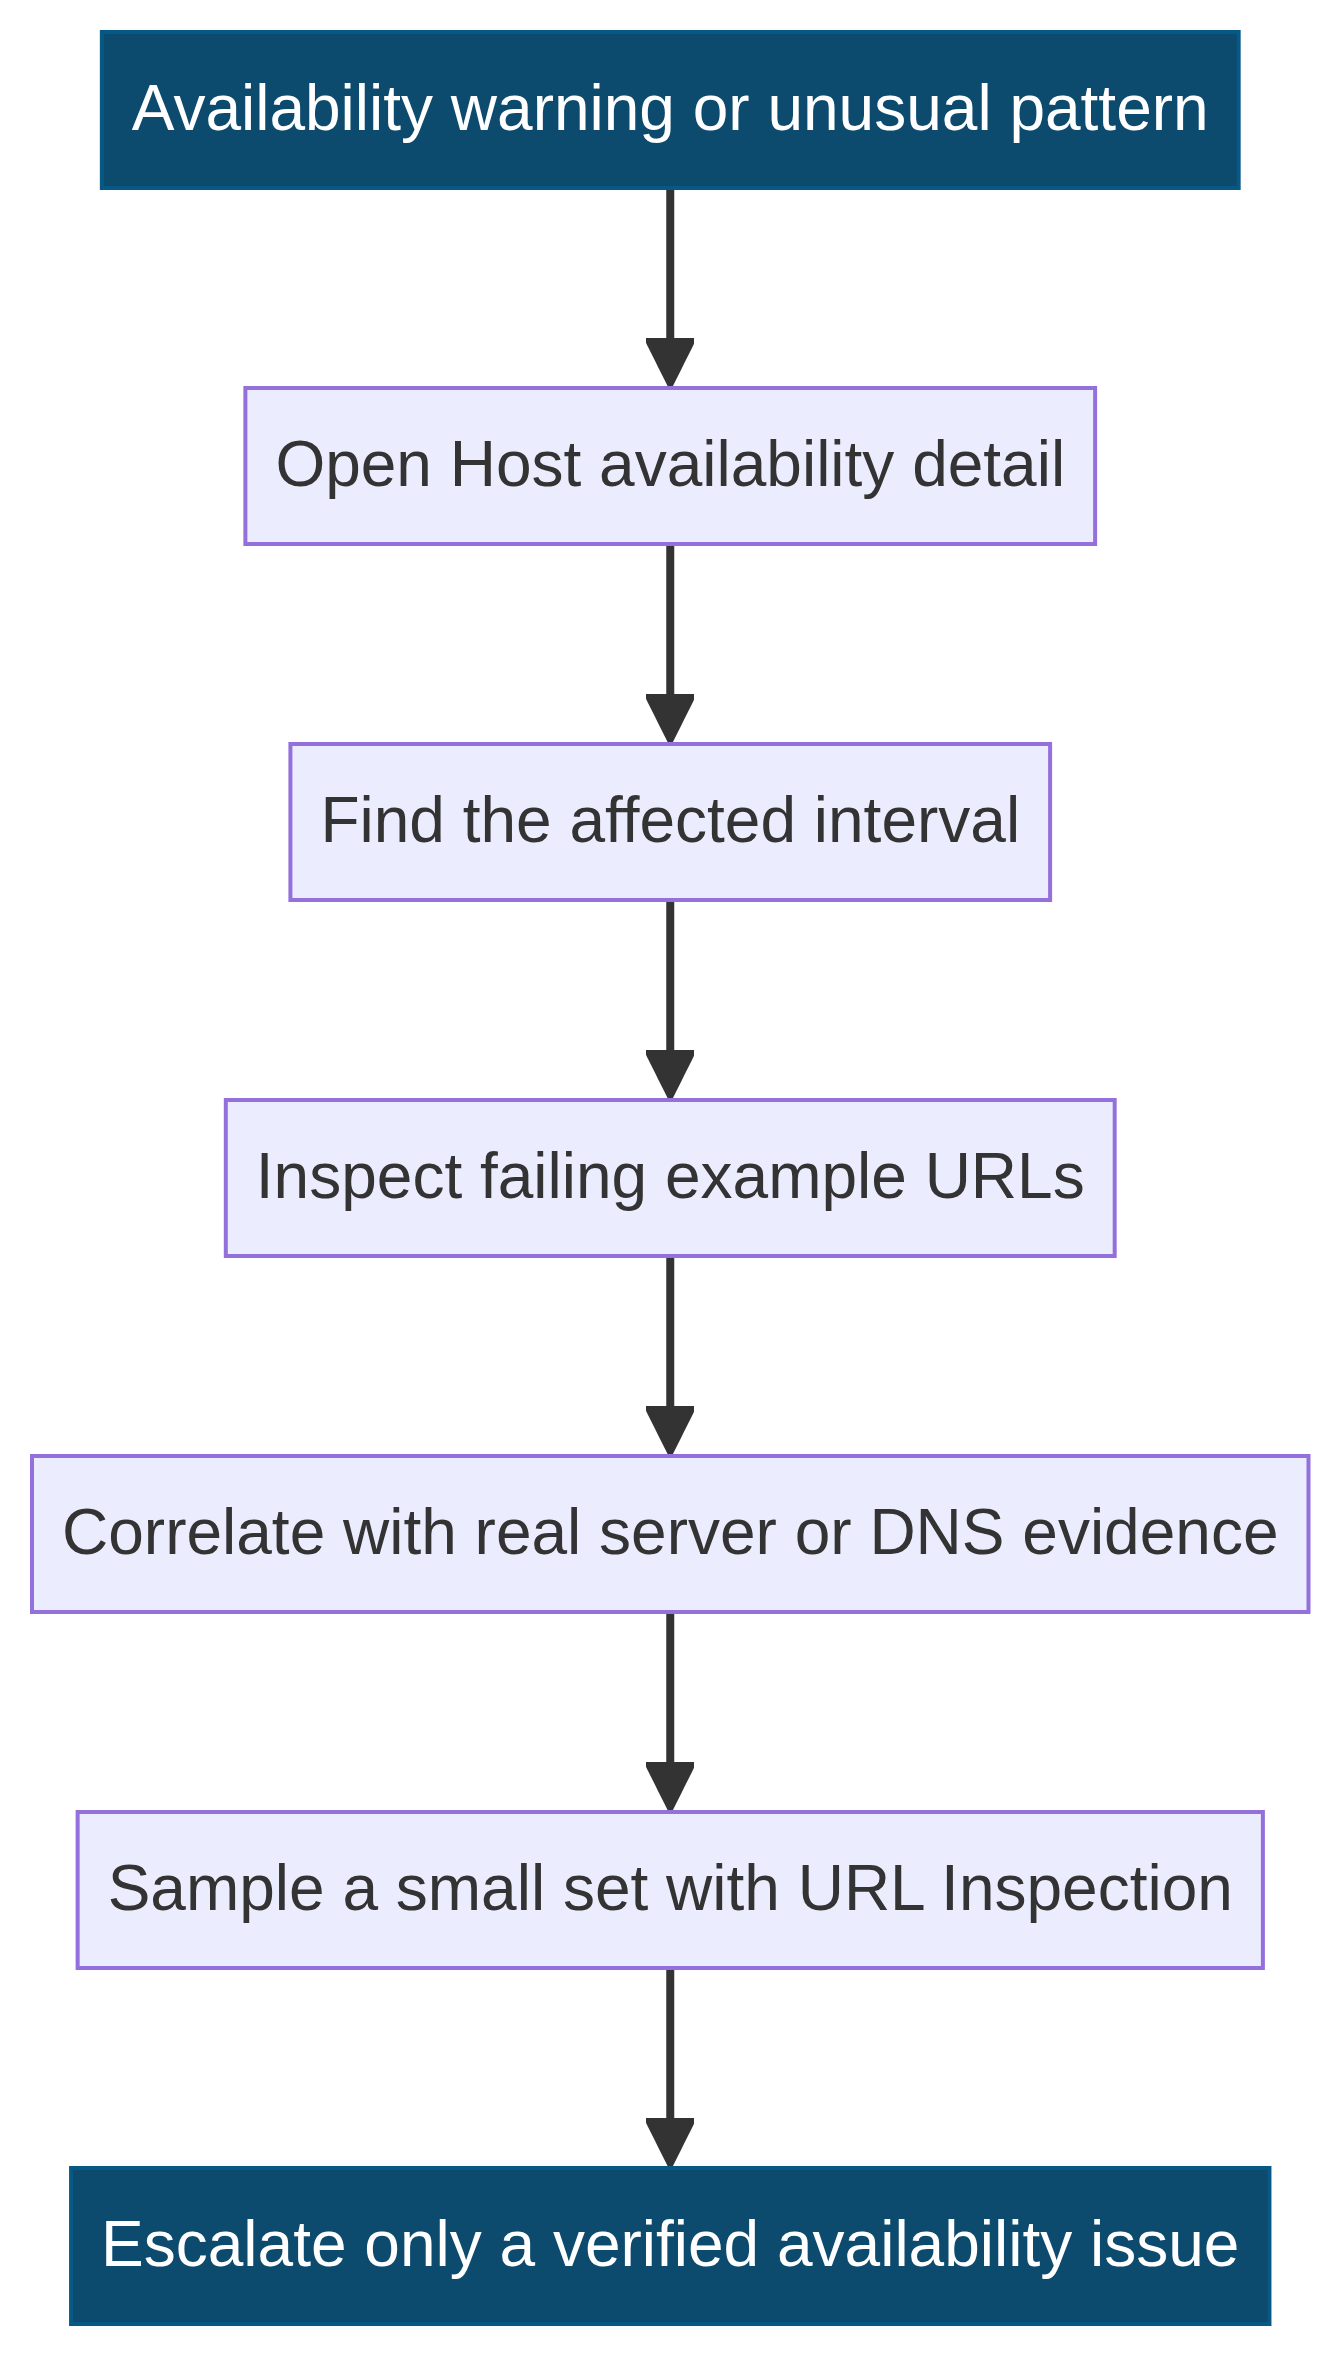
Host status describes whether Google encountered availability issues while trying to crawl the site. Search Console can report no significant issues, older availability issues, or recent availability issues. Its details can include robots.txt fetching, DNS resolution, and server connectivity, with failure-rate information and recency. This is a site-availability signal, not a general website-health score. [1]
A recent warning should be read alongside the site’s own evidence. Did the host record downtime? Did DNS change? Did a firewall, application update, or maintenance window correspond to the interval? Did the affected example URLs share a path or response? These questions turn a report warning into a bounded investigation. They also avoid an unhelpful reaction: changing cache, hosting, or crawl settings without knowing which condition was actually observed.
Investigate an availability pattern proportionately
Google’s crawl-error guidance gives a sensible sequence. If a host-availability graph reports errors or warnings, locate where requests exceeded the red limit, click into the graph, identify failing URLs, and correlate them with actual site issues. Use URL Inspection on a small set of relevant URLs if the individual status needs more context. A Hostload exceeded warning means Googlebot could not crawl as many URLs as it discovered. [4]
This is not an instruction to test every URL or to deploy a speculative fix. Start with the short interval and representative examples, then preserve the evidence: property scope, timeframe, host-status category, affected URL samples, code or connectivity condition, and any host confirmation. If a verified capacity or availability issue exists, involve the appropriate hosting or development owner with that packet. If the evidence is incomplete, state that it is incomplete and schedule a limited later recheck.
Do not treat a low crawl rate as a failure by default
Google defines crawl budget as the set of URLs Google can and wants to crawl, combining crawl capacity limit and crawl demand. It also explains that crawl-budget optimization is primarily an advanced concern for large, frequently updated, or heavily discovered-but-not-indexed sites. For many sites, a current sitemap and regular Page Indexing review are enough. [2]
Therefore, a lower crawl-request total is not automatically a repair ticket. If important URLs are crawlable, public responses are sound, the site has no verified availability issue, and Page Indexing does not identify a relevant problem, a normal variation in requests may need no action. It is safer to maintain a clean URL inventory, accurate sitemaps, useful internal links, and efficient pages than to force activity. The appropriate question is whether a documented crawler constraint is limiting a genuinely important site need.
Do not treat a crawl spike as an SEO win
A request spike can have many explanations: a release that exposed new URLs, a redirect chain, an update to pages or resources, a temporary retry pattern, or a shift in Google’s crawling. The report may show when a change occurred, but not why it occurred or what downstream search effect it will have. Do not label the spike “greater visibility,” “stronger authority,” or “indexing growth” without separate evidence. [1]
A calm review starts with the report groupings. Did one response class rise? Did file type change? Are the examples current canonical pages, duplicate URLs, resources, or retired paths? Was there a site move, sitemap change, or outage record? If no risky condition is present, log the observation and recheck at a later interval. A durable decision record makes it easier to identify a pattern if it persists, while avoiding a needless configuration change after a one-off fluctuation.
Connect Crawl Stats to URL inventory hygiene
When a report reveals recurring requests to unnecessary URLs, the correct response depends on why those URLs exist. Google’s crawl-budget guidance recommends managing URL inventory, returning 404 or 410 for permanently removed pages, eliminating soft 404 errors, keeping sitemaps current, avoiding long redirect chains, and making pages efficient to load. These are durable site-maintenance practices, not a recipe for inflating a graph. [2]
Start by classifying a sample: active page, redirect, intentionally gone page, parameter variation, resource, protected route, or unexpected template path. Then confirm whether it is linked internally, listed in a sitemap, declared canonical, or exposed by a broken navigation pattern. Use the smallest truthful correction that addresses the verified cause. Do not create broad redirects for unrelated retired URLs just to change a crawl statistic; a direct redirect needs an equivalent current destination, and an absent page can legitimately remain absent.
Keep Crawl Stats beside—not inside—an SEO verdict
A useful technical review keeps separate evidence columns. Crawl Stats can describe request history and availability. Public response checks can describe a current URL response and redirect path. Page Indexing can describe an indexed-state category. URL Inspection can provide individual URL information. Search performance reports can describe recorded impressions, clicks, and position measures for a selected scope. None of these sources should be silently substituted for another.
This separation improves communication. Instead of “Google is not ranking the page because crawl requests fell,” write a factual observation such as: “Crawl Stats shows fewer HTML requests in the stated period; Page Indexing and URL Inspection were reviewed separately; no causal claim is made from the request total alone.” The second sentence tells a site owner exactly what was measured, what still needs investigation, and why a decision was or was not taken.
Create a compact operational review record
A small monthly or incident-driven record is often enough. Include the selected property, review date, report interval, overview observation, relevant grouping, example URLs, public response or host evidence, related release, decision, owner, and later check date. Add a short limits field: “Crawl request data is not a canonical, index-inclusion, or ranking measure.” This avoids turning a screenshot into an undocumented technical conclusion.
The review need not be elaborate. A small business with a stable site may only need a single paragraph when a meaningful event occurs. A larger or rapidly changing site may maintain a shared runbook and incident record. In both cases, write what was actually observed and what was checked next. This makes a later comparison possible without implying that every report change has a single cause or a predetermined SEO outcome.
A practical checklist before action
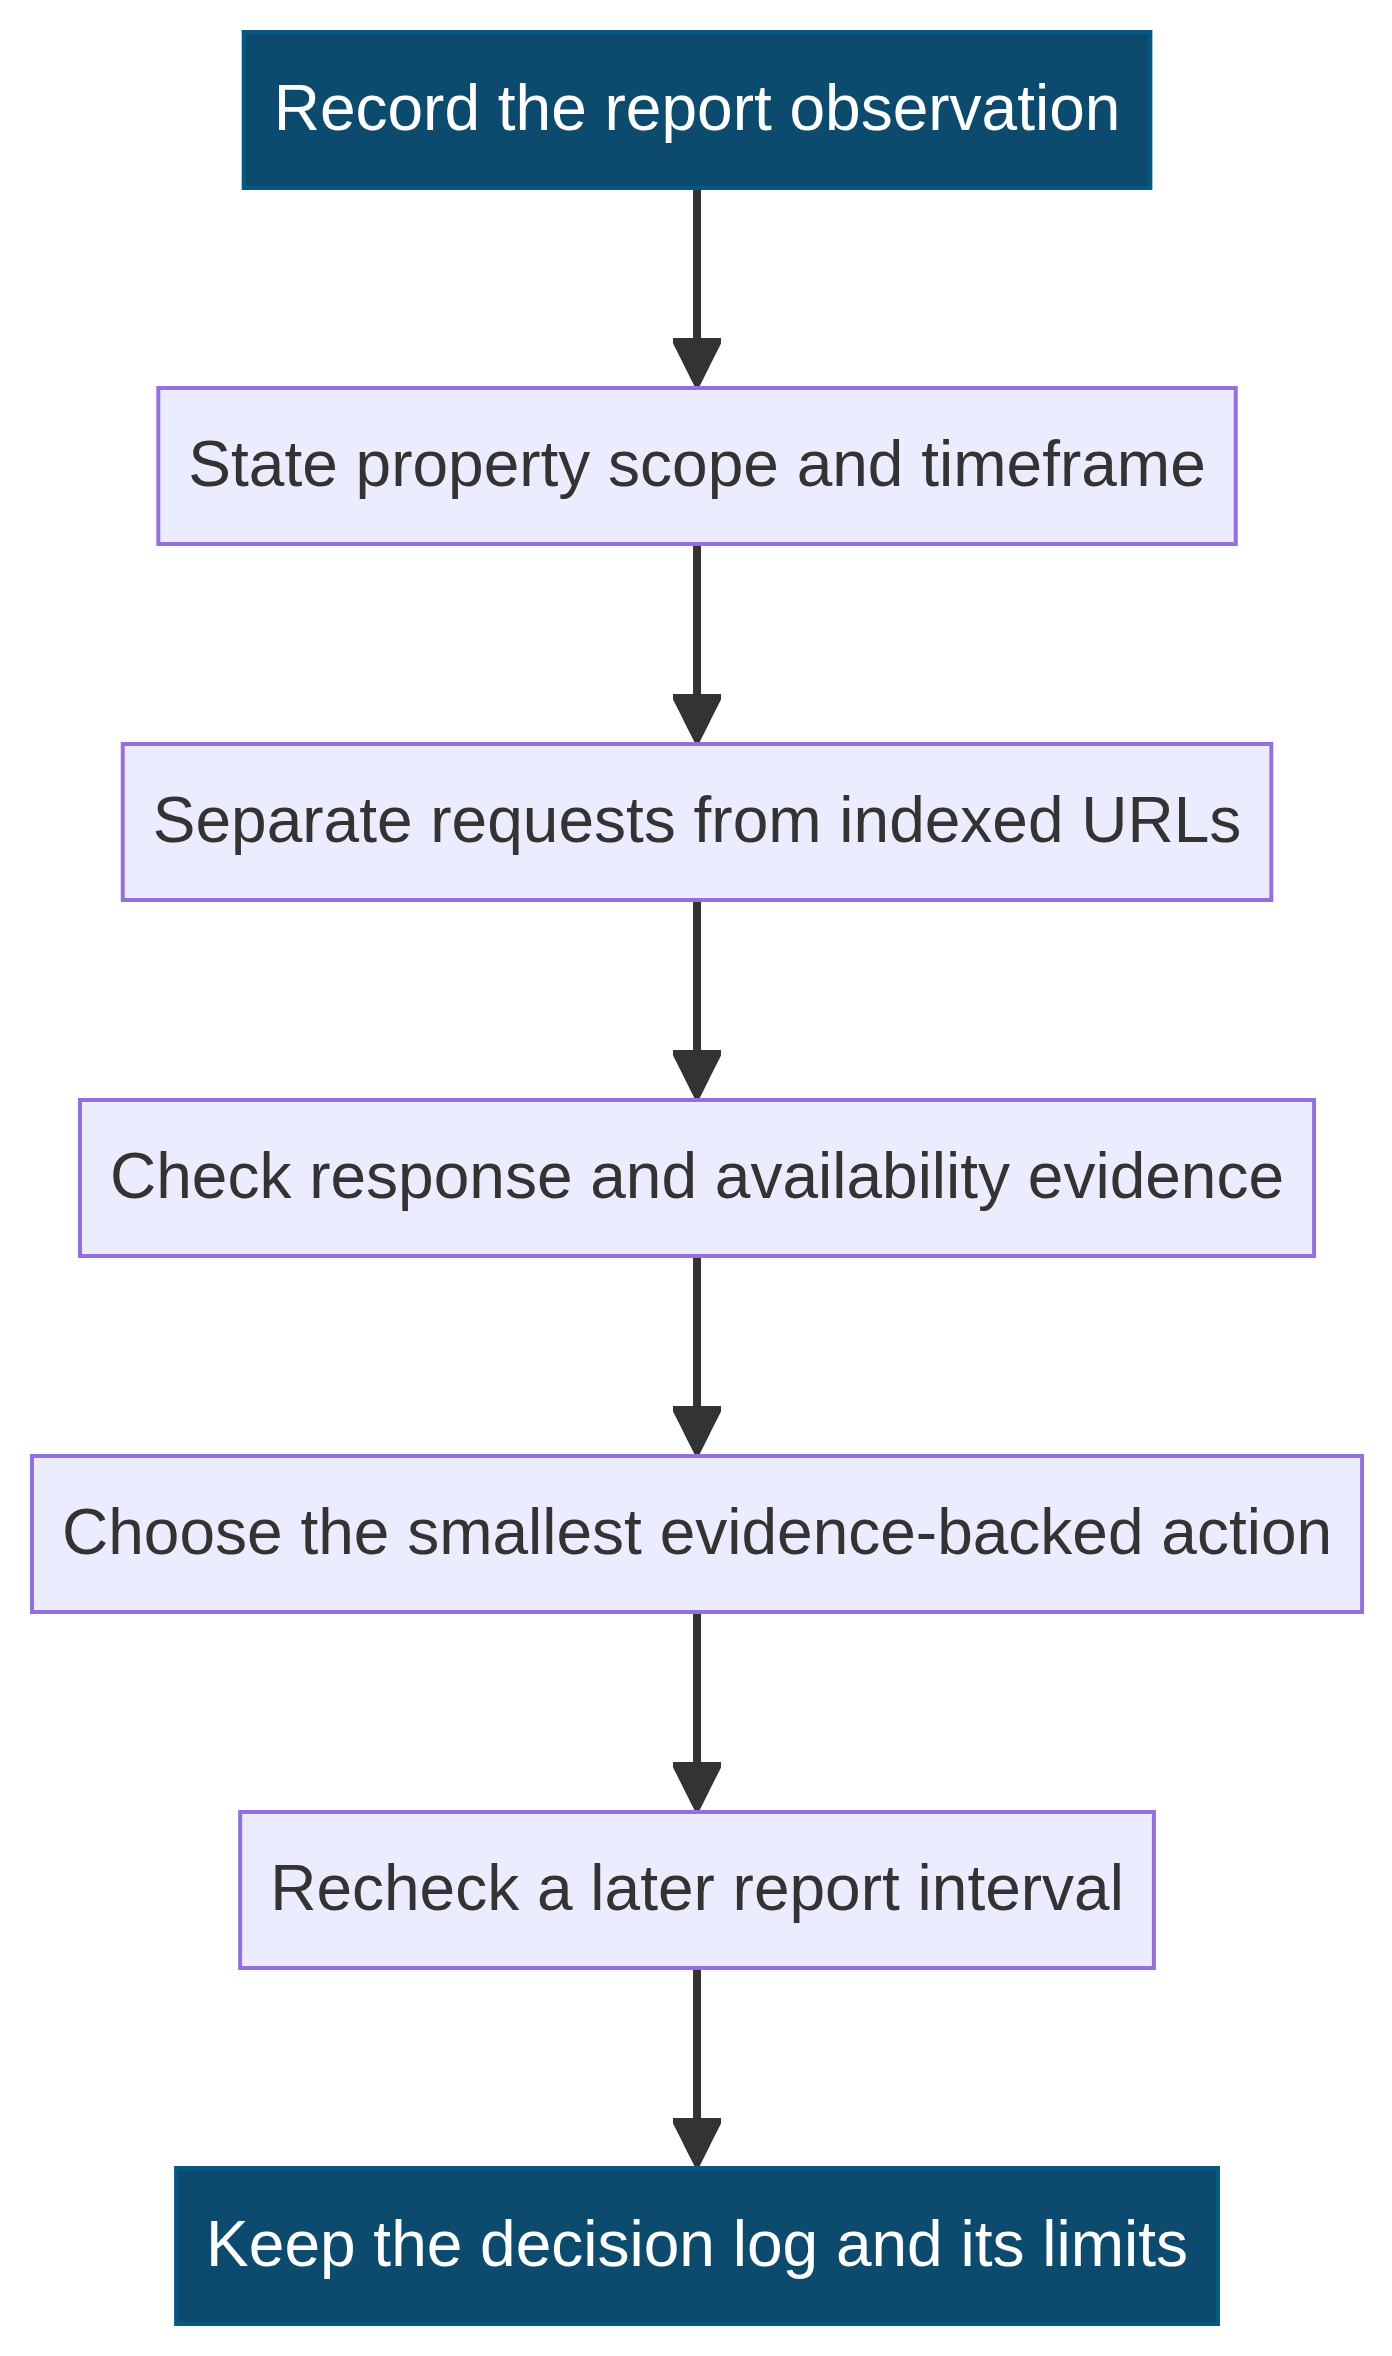
Before changing a site because of Crawl Stats, confirm five basics. First, verify the selected root property and report interval. Second, name the exact chart or grouping that prompted the question. Third, inspect representative example URLs and identify their actual response or path. Fourth, compare the finding with independent evidence such as host records, a deployment log, a sitemap, Page Indexing, or a small URL Inspection sample. Fifth, decide whether a minimal verified action exists, or whether the correct response is to recheck later.
The checklist deliberately does not include targets for request volume, download size, or average response time. Those figures need context. Do not reduce a report to a score, delete valid URLs to lower a line, block crawling as a default response, or change server settings without a documented constraint. If a verified availability, inventory, redirect, or response problem exists, capture its initial state, apply the smallest safe correction, and review the relevant evidence again after an appropriate interval.
Final perspective
Search Console Crawl Stats is most valuable when it turns a vague concern into a smaller, evidence-led question. It can show that Google’s crawlers made requests, encountered a reported response pattern, or saw an availability issue within a defined property and interval. It cannot determine what a page should rank for, settle a URL’s later index state, or prove why a performance metric changed. That restraint is part of using the report well.
Start with scope, record the interval, use the native groupings to narrow the observation, inspect representative URLs, and correlate a report signal with independent technical evidence. Then act only on a verified need and retain the decision record. This approach gives teams a practical way to understand crawl history while preserving the difference between crawler activity, page-level status, and search outcomes.