
Search Console bulk data export gives property owners a way to send ongoing Search Console performance records into a BigQuery project. This guide explains how to decide whether it fits the reporting need, configure it carefully, interpret the exported tables, and maintain an evidence-led reporting process without treating a data connection as a promise about Google outcomes.
What Search Console bulk data export is
Search Console bulk data export is an ongoing transfer of Search performance data from a verified Search Console property into a Google BigQuery project. It is not a replacement for the Search Console interface, an automatic audit, or a publishing tool. Its practical value is that a team can keep a queryable dataset under its own Cloud project, define repeatable calculations, and combine the exported records with carefully governed first-party business data. Google describes the feature as a daily export rather than an on-demand retrieval mechanism. [1]
That definition sets a useful boundary. The export helps a team study the performance information Search Console makes available; it does not change how a page is discovered, selected, or presented in Google systems. A reliable article, dashboard, or review meeting should say what date range, table, filters, and calculation were used. It should not turn a data connection into a claim about future outcomes. Treat the export as reporting infrastructure: it can make a question reproducible, but it cannot make an ambiguous question well defined.
Decide whether an ongoing export is proportionate
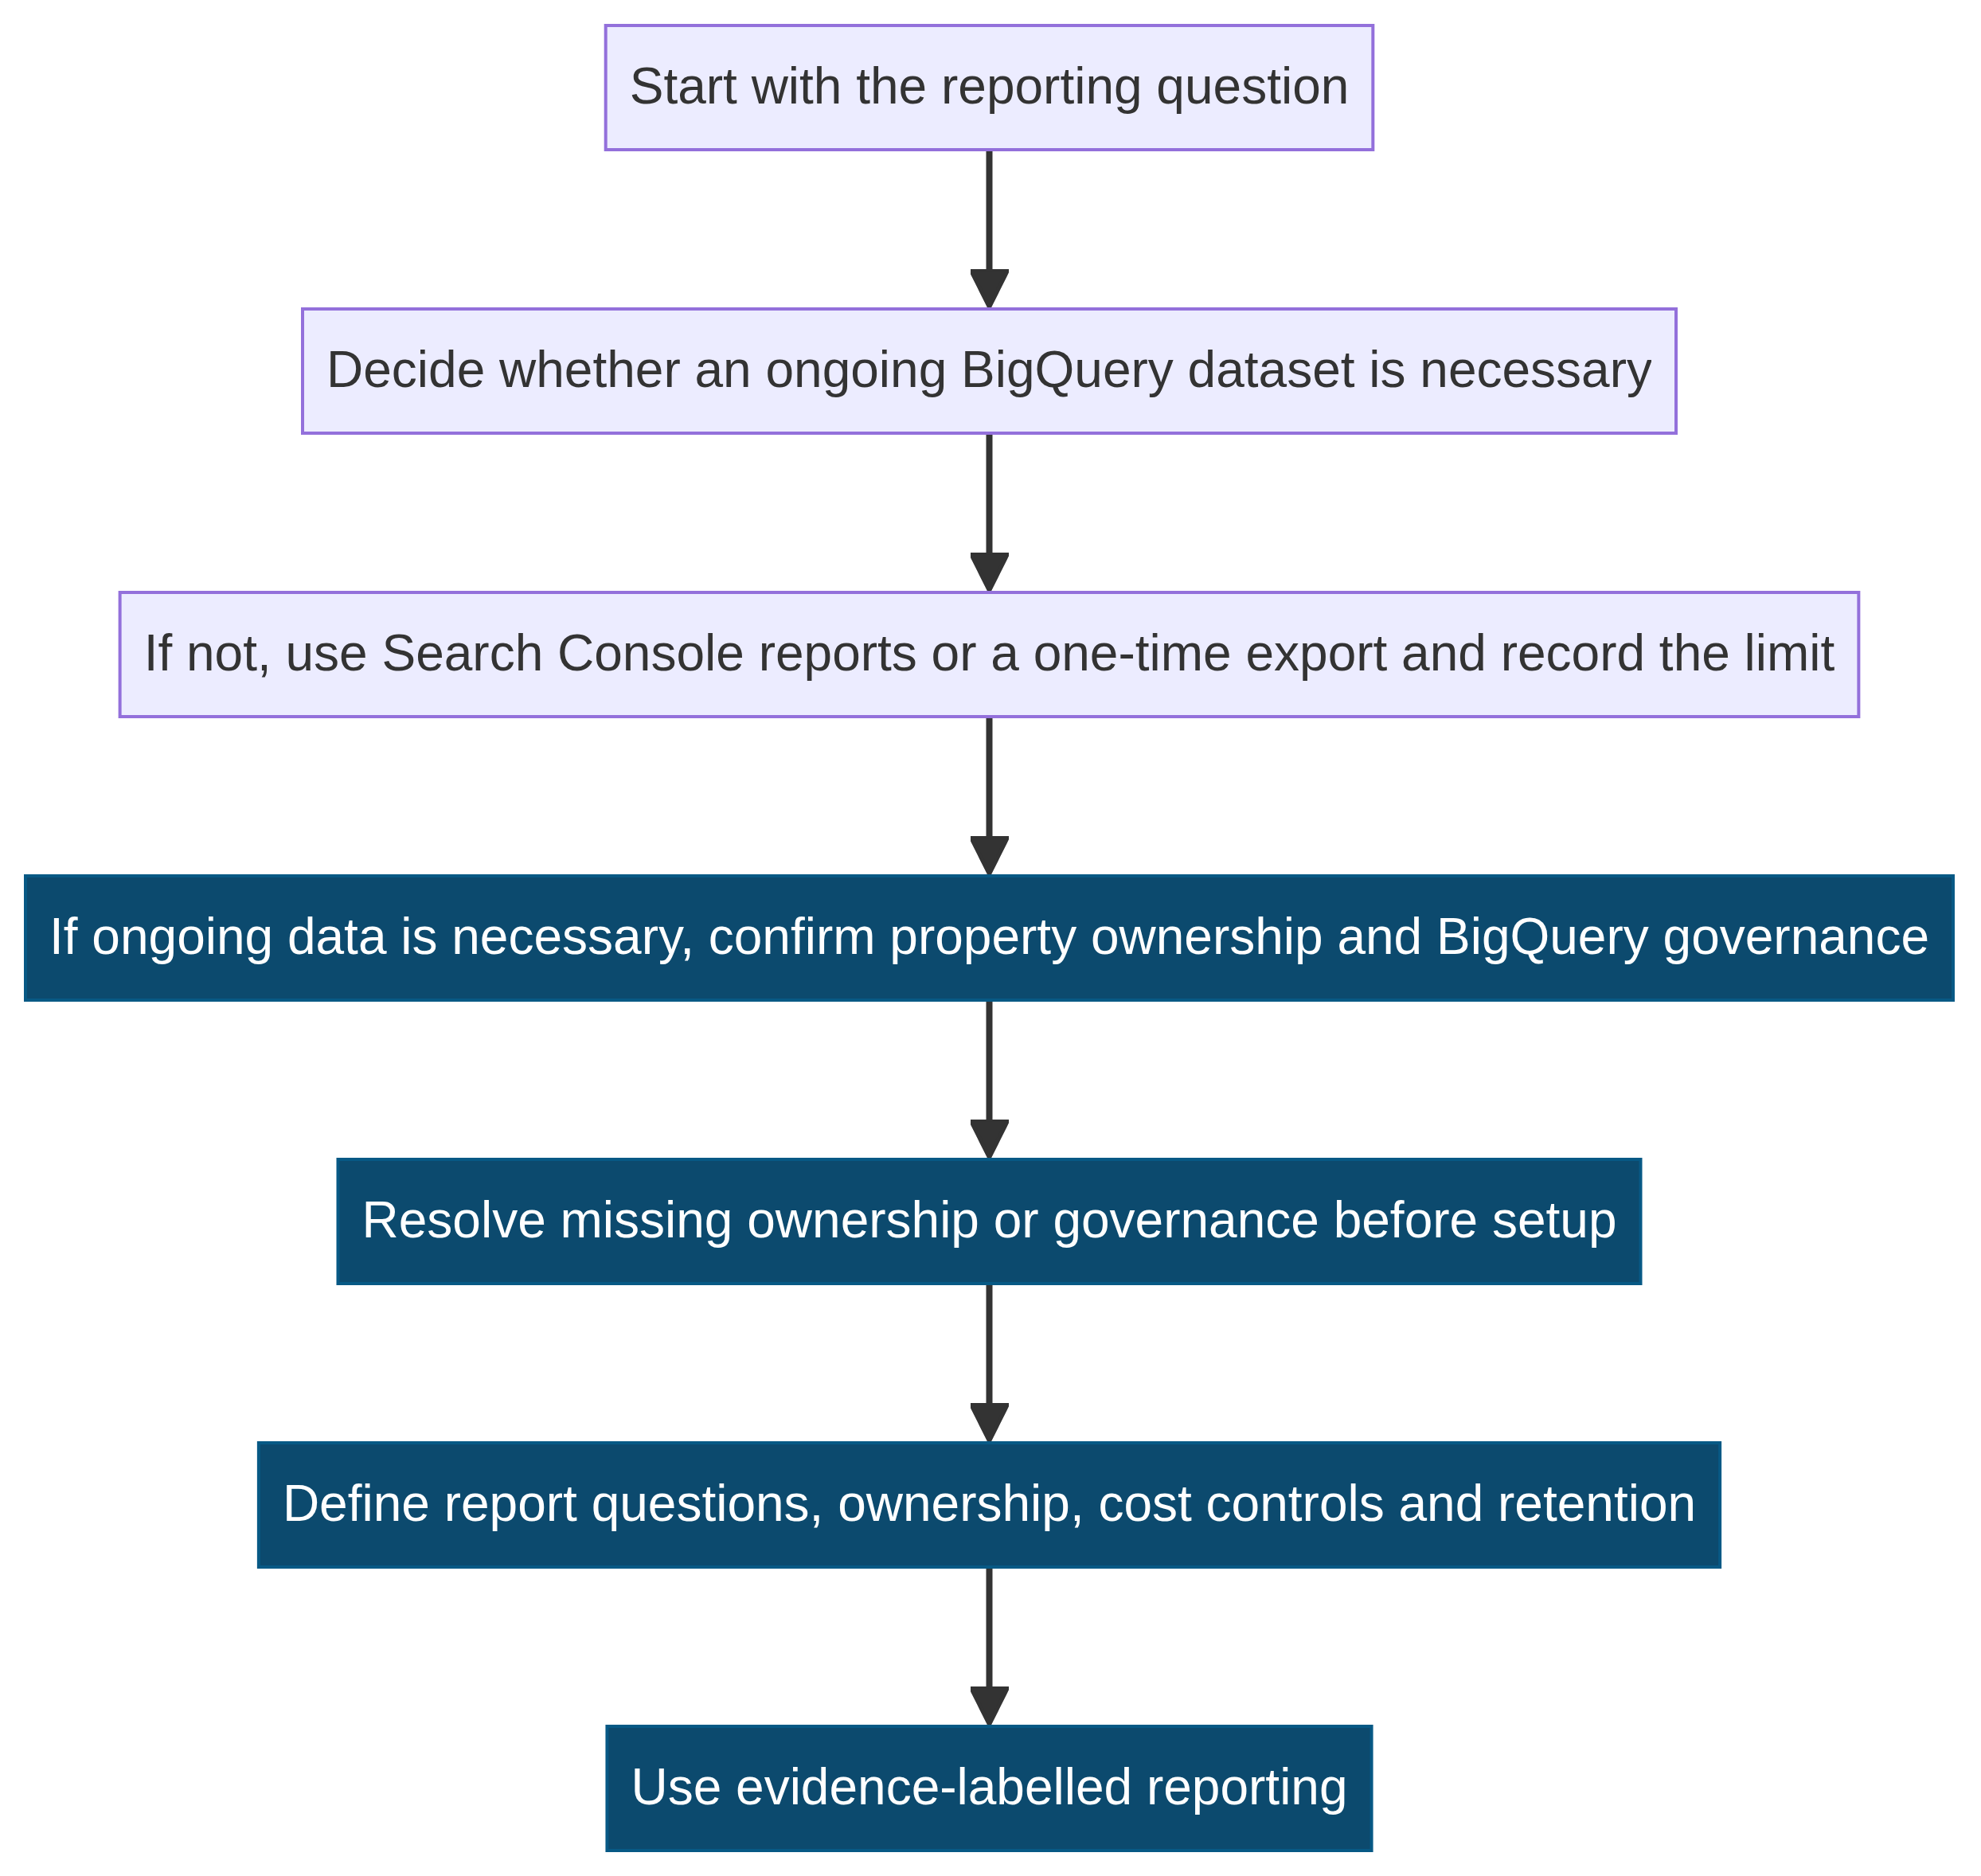
Begin with the reporting question, not the tool. An ongoing export can be reasonable when several people need a shared historical view, when a large property requires more flexible aggregation, or when a team needs to join Search Console measures to a governed page inventory, content catalogue, or release log. A smaller site may instead find the Search Console reports, an occasional download, a Looker Studio connector, or the Search Analytics API sufficient for the task. Google explicitly presents several of those alternatives for smaller and medium-sized sites. [3]
Write down the question in one sentence before requesting Cloud access. For example: “Which canonical landing pages received web-search impressions in the last completed calendar month, split by device?” This is materially better than “find growth opportunities,” because it names the object, channel, time range, and comparison boundary. The question guides table choice, fields, filters, validation, and retention. It also makes it easier for a second reviewer to spot a changed definition before two reports are compared.
Confirm ownership, access, and governance first
The person configuring the export needs the authority to act for the Search Console property, and the Cloud project must be governed by people who can manage billing, access, data location, and retention. These are practical controls rather than formalities. A team should know who can change the project, who can query the dataset, how access is reviewed, and where the runbook lives if an export fails. Avoid using a personal throwaway project for a business reporting system; ownership gaps can make ordinary maintenance difficult later.
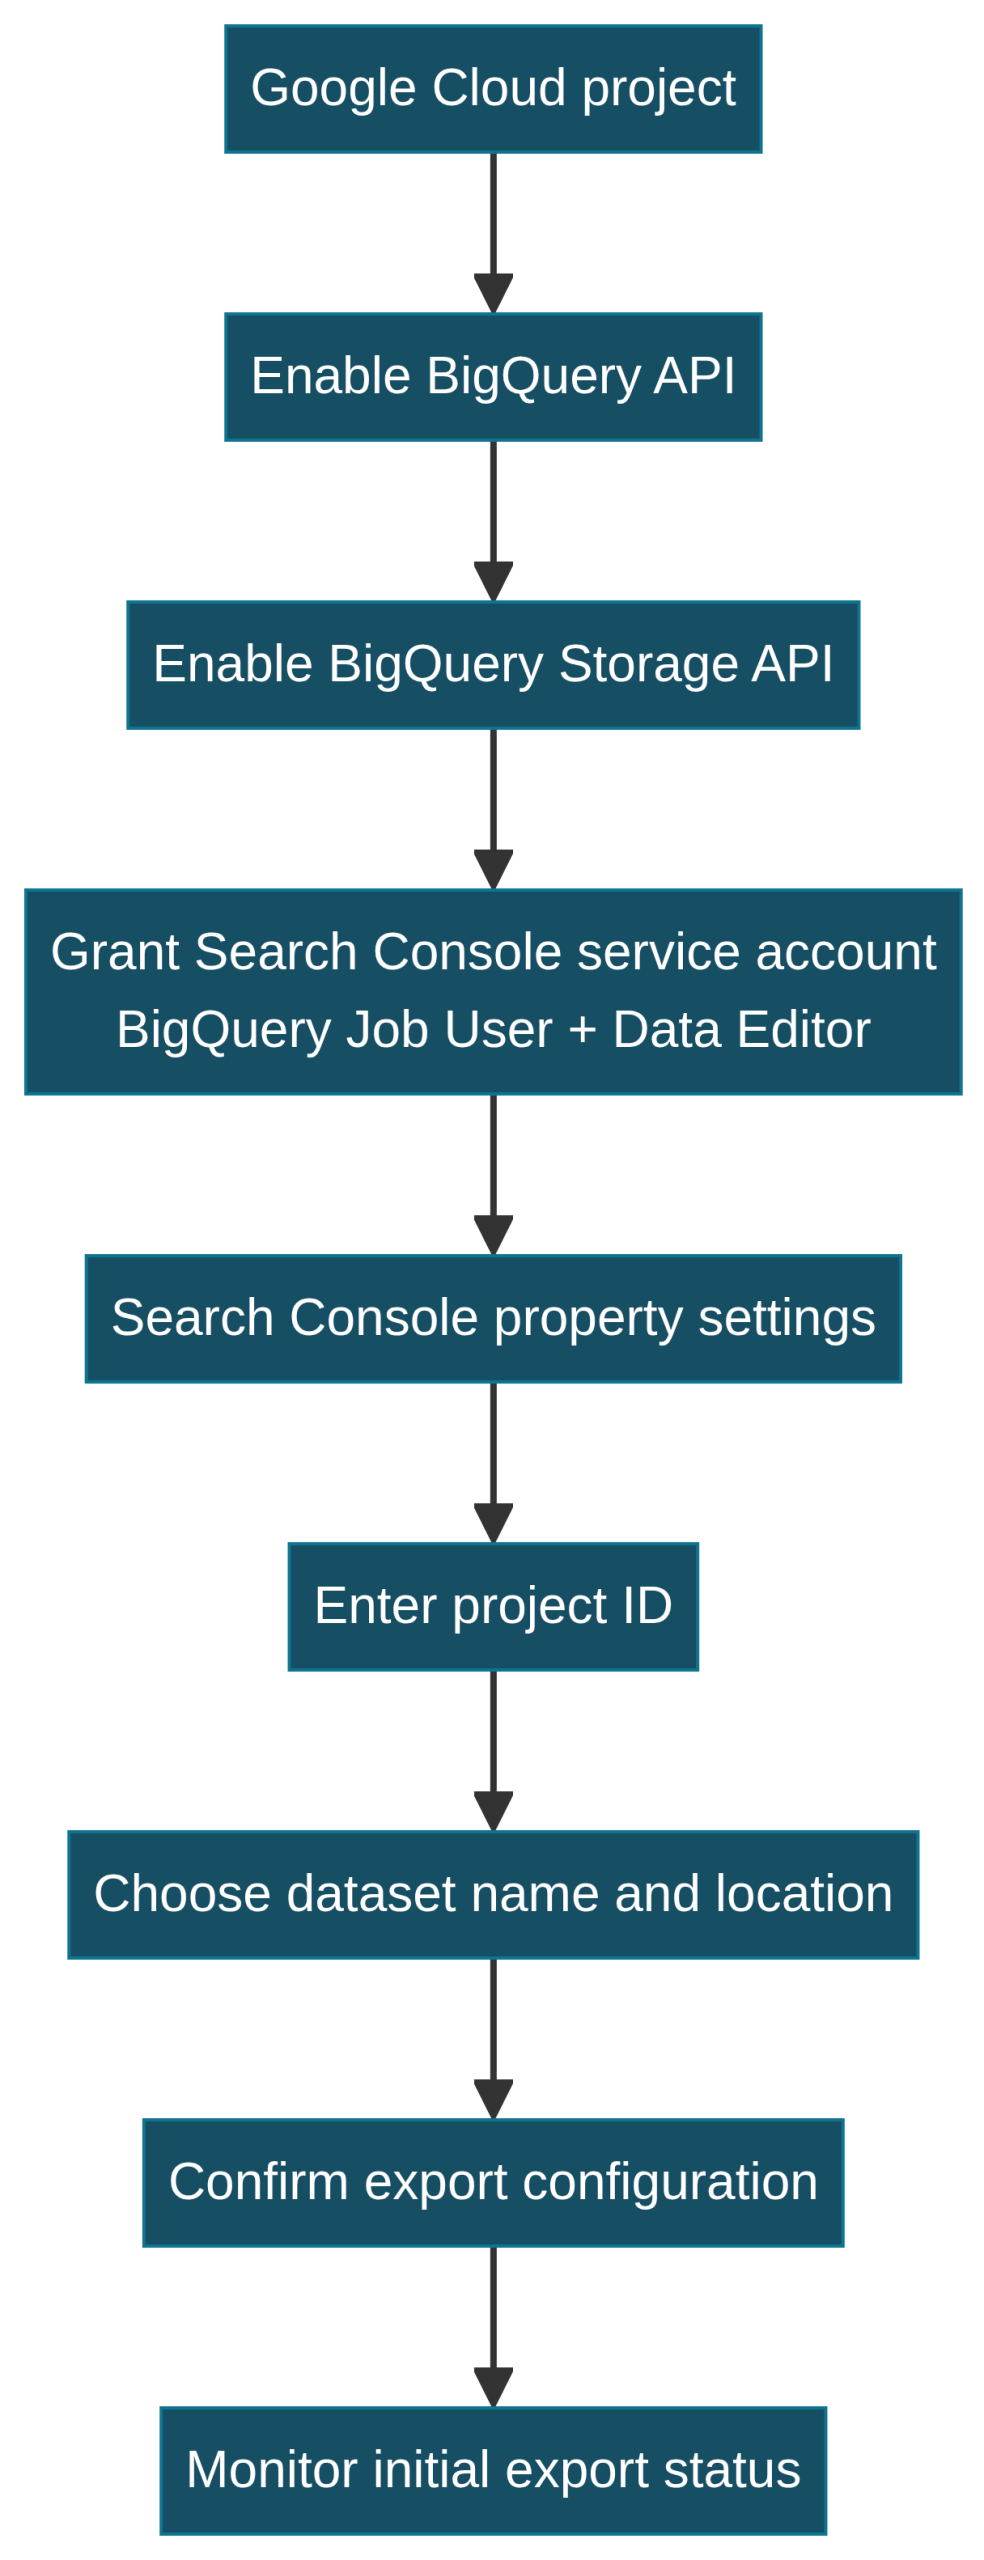
Google’s setup guidance requires a Google Cloud project with billing configured and BigQuery enabled. The Cloud side also grants the Search Console export service account the BigQuery Job User and BigQuery Data Editor roles. Record the project ID, dataset name, dataset location, property scope, operator, and approval date in an internal change record. [1] This simple record makes it possible to distinguish a missing permission, a changed location, and an unrelated reporting issue without guessing from a chart.
Prepare the Google Cloud project deliberately
Cloud preparation is where many avoidable failures begin. Enable both the BigQuery API and the BigQuery Storage API for the selected project, then grant the documented roles to the Search Console export service account. Use the project ID rather than the project number when entering the destination in Search Console. Google notes that the selected dataset location is not easily changed once exports begin, so confirm organizational, data-residency, and reporting needs before selecting it. [1]
Give the dataset a name that distinguishes the property and its purpose when more than one property could share a project. The Search Console guidance notes that the dataset name begins with “searchconsole”, even when customized. Decide whether access should be direct, group-based, or routed through a reporting service account, and document the reason. Those decisions are not editorial details: a report can be technically accurate yet unusable if its source cannot be accessed, its owner is unknown, or its location conflicts with team policy.
Configure the destination in Search Console
After Cloud preparation, use the property’s Settings area in Search Console to open Bulk data export. Enter the Cloud project ID, choose the dataset name and location, and confirm the configuration. The interface performs an initial validation. If it detects an immediate access problem, the owner should receive a prompt indication; otherwise the scheduled export process begins. Google says the first export can occur up to 48 hours after successful configuration and includes the data for the export day. [1]
Do not write a retrospective narrative on the day the configuration is submitted. Bulk export does not backfill older performance data that predates setup. If a report needs prior periods, use the Search Console reports or API for that limited historical question and label the sources separately. [1] Mixing differently sourced time periods without a note can create a false comparison. An honest dashboard identifies its first export date and avoids quietly treating the dataset as a complete archive from the beginning of the property.
Know the three exported tables
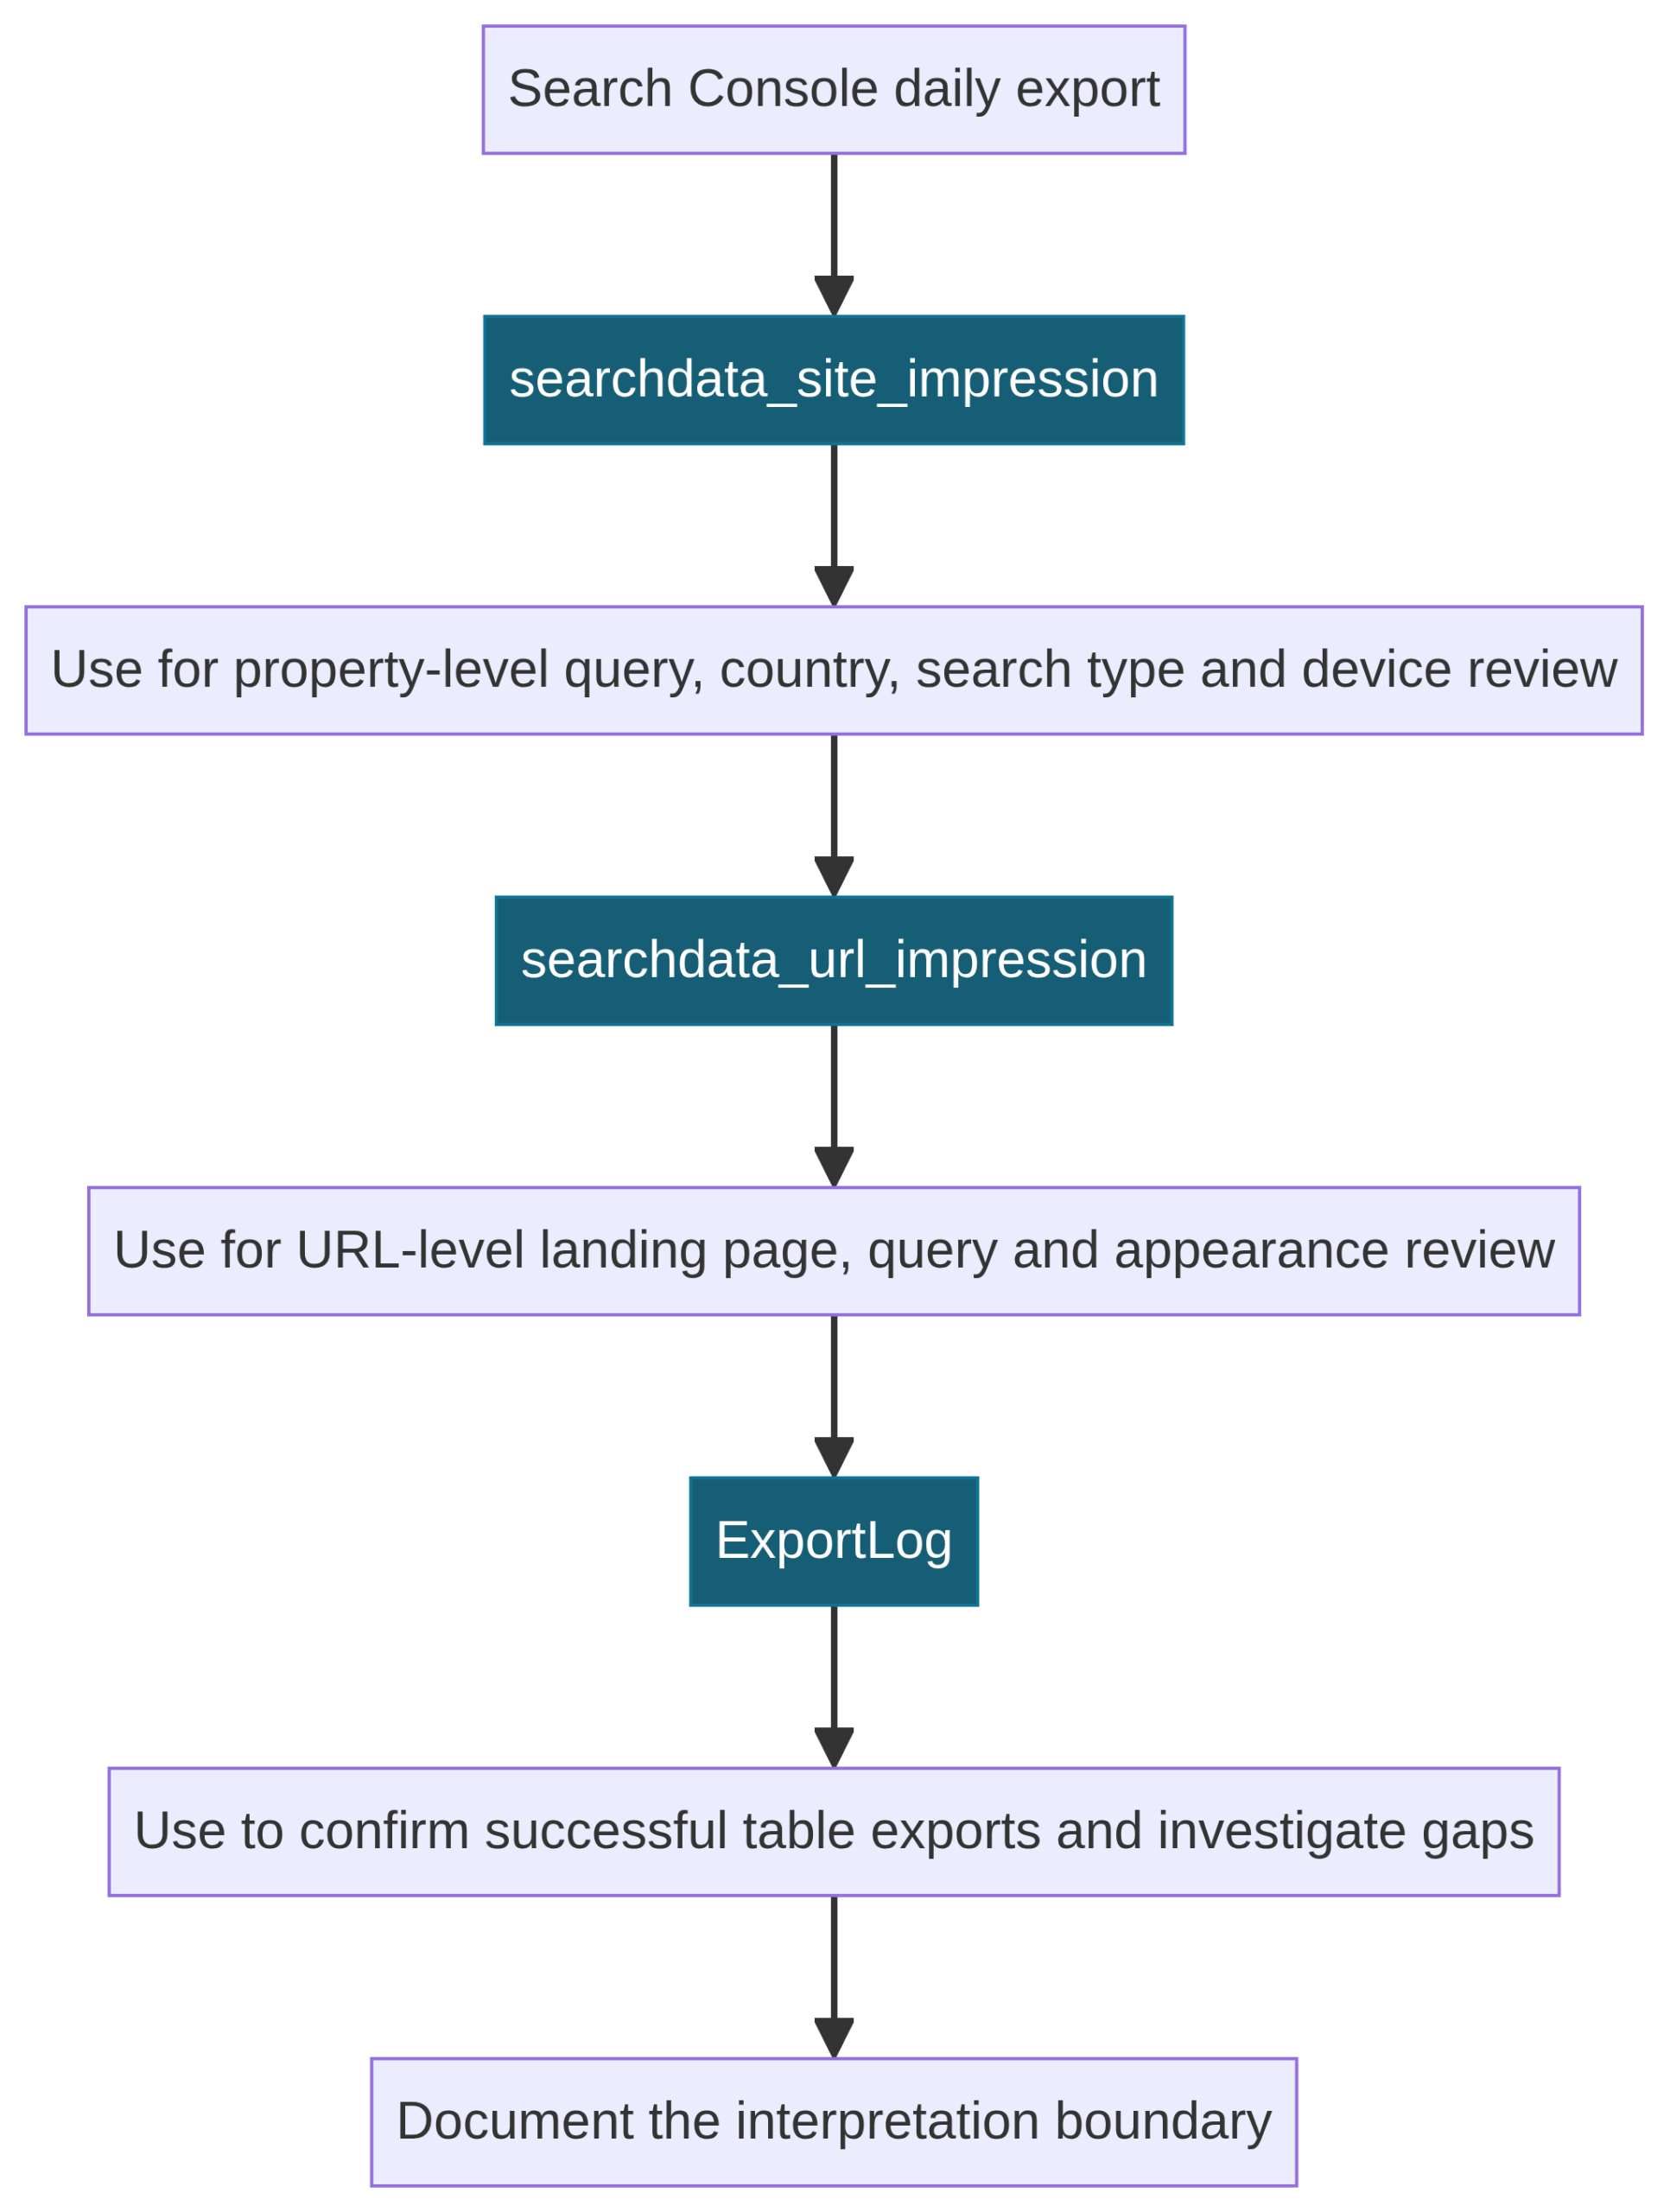
Search Console documents three core export tables. The “searchdata_site_impression” table is organized around property-level performance records. The “searchdata_url_impression” table supports URL-level landing-page, query, and search-appearance analysis. “ExportLog” records successful exports to the data tables. Those labels describe different analysis grains; they are not interchangeable views of one report. [2]
Choose the table that matches the question before writing a query. A question about the property’s query/device/country mix generally begins with the property table. A question about which landing pages received records for a selected query or appearance type generally begins with the URL table. A question about whether the scheduled transfer completed begins with “ExportLog”. Use the same table and grain when comparing periods unless the change is explicitly called out. Figure 3 provides a simple map of the table roles.
Use property-level records for property questions
The property-level table includes fields such as date, property identifier, query, country, search type, device, impressions, clicks, and a position input. It is designed for questions that describe the property’s observed performance record at that aggregate level. Google documents that the data date uses Pacific Time, a detail that matters when an internal dashboard or business calendar uses another time zone. [2]
Keep the scope visible in a report header. A property-level query may answer “what was recorded for this property and search type?” but it cannot automatically explain which individual landing-page edit caused a movement or which user intent is represented by an aggregate label. If the analysis introduces a classification, such as branded versus non-branded queries, preserve the classification rules and the version used. A reviewer should be able to reproduce the grouping rather than infer it from a chart title.
Use URL-level records for landing-page questions
The URL-level table contains the final landing URL, alongside query, country, search type, device, appearance flags, impressions, clicks, and a position input. It is the appropriate starting point when the question is tied to a canonical page, a content group, a page template, or a documented launch. Google describes the URL as the fully qualified destination where the user eventually lands after selecting a Search result or Discover story. [2]
A URL table is not a substitute for a page inventory. Normalize or map URLs only through a documented method, and preserve the original URL field for auditability. Be careful when a site has parameters, redirects, locale variants, or historical paths. If an internal page group excludes certain patterns, include the exclusion logic in the report notes. That distinction keeps a technical URL classification from being mistaken for a conclusion about the page’s relevance or quality.
Read ExportLog as an operational record
ExportLog records information about successful writes for the exported data tables. Google notes that the two performance tables are commonly exported separately, so a completed day can produce separate records. It also notes that unsuccessful attempts are not recorded in this log. [2] That makes ExportLog a useful evidence source for what completed, but not a complete incident history. If a date or table is missing, the team should inspect permissions, schema modifications, project settings, and relevant service status rather than infer the cause from absence alone.
Google’s documentation says bulk data exports run daily, though not necessarily at the same time for each table. For a non-transitory issue such as a permissions problem, retries occur on the next scheduled cycle, and the platform can retry missed days for about a week after the issue is fixed. [2] Record the observed data date, the tables present, and the check time. This creates a modest but useful control record without claiming that a single check proves permanent data completeness.
Aggregate the rows before interpreting metrics
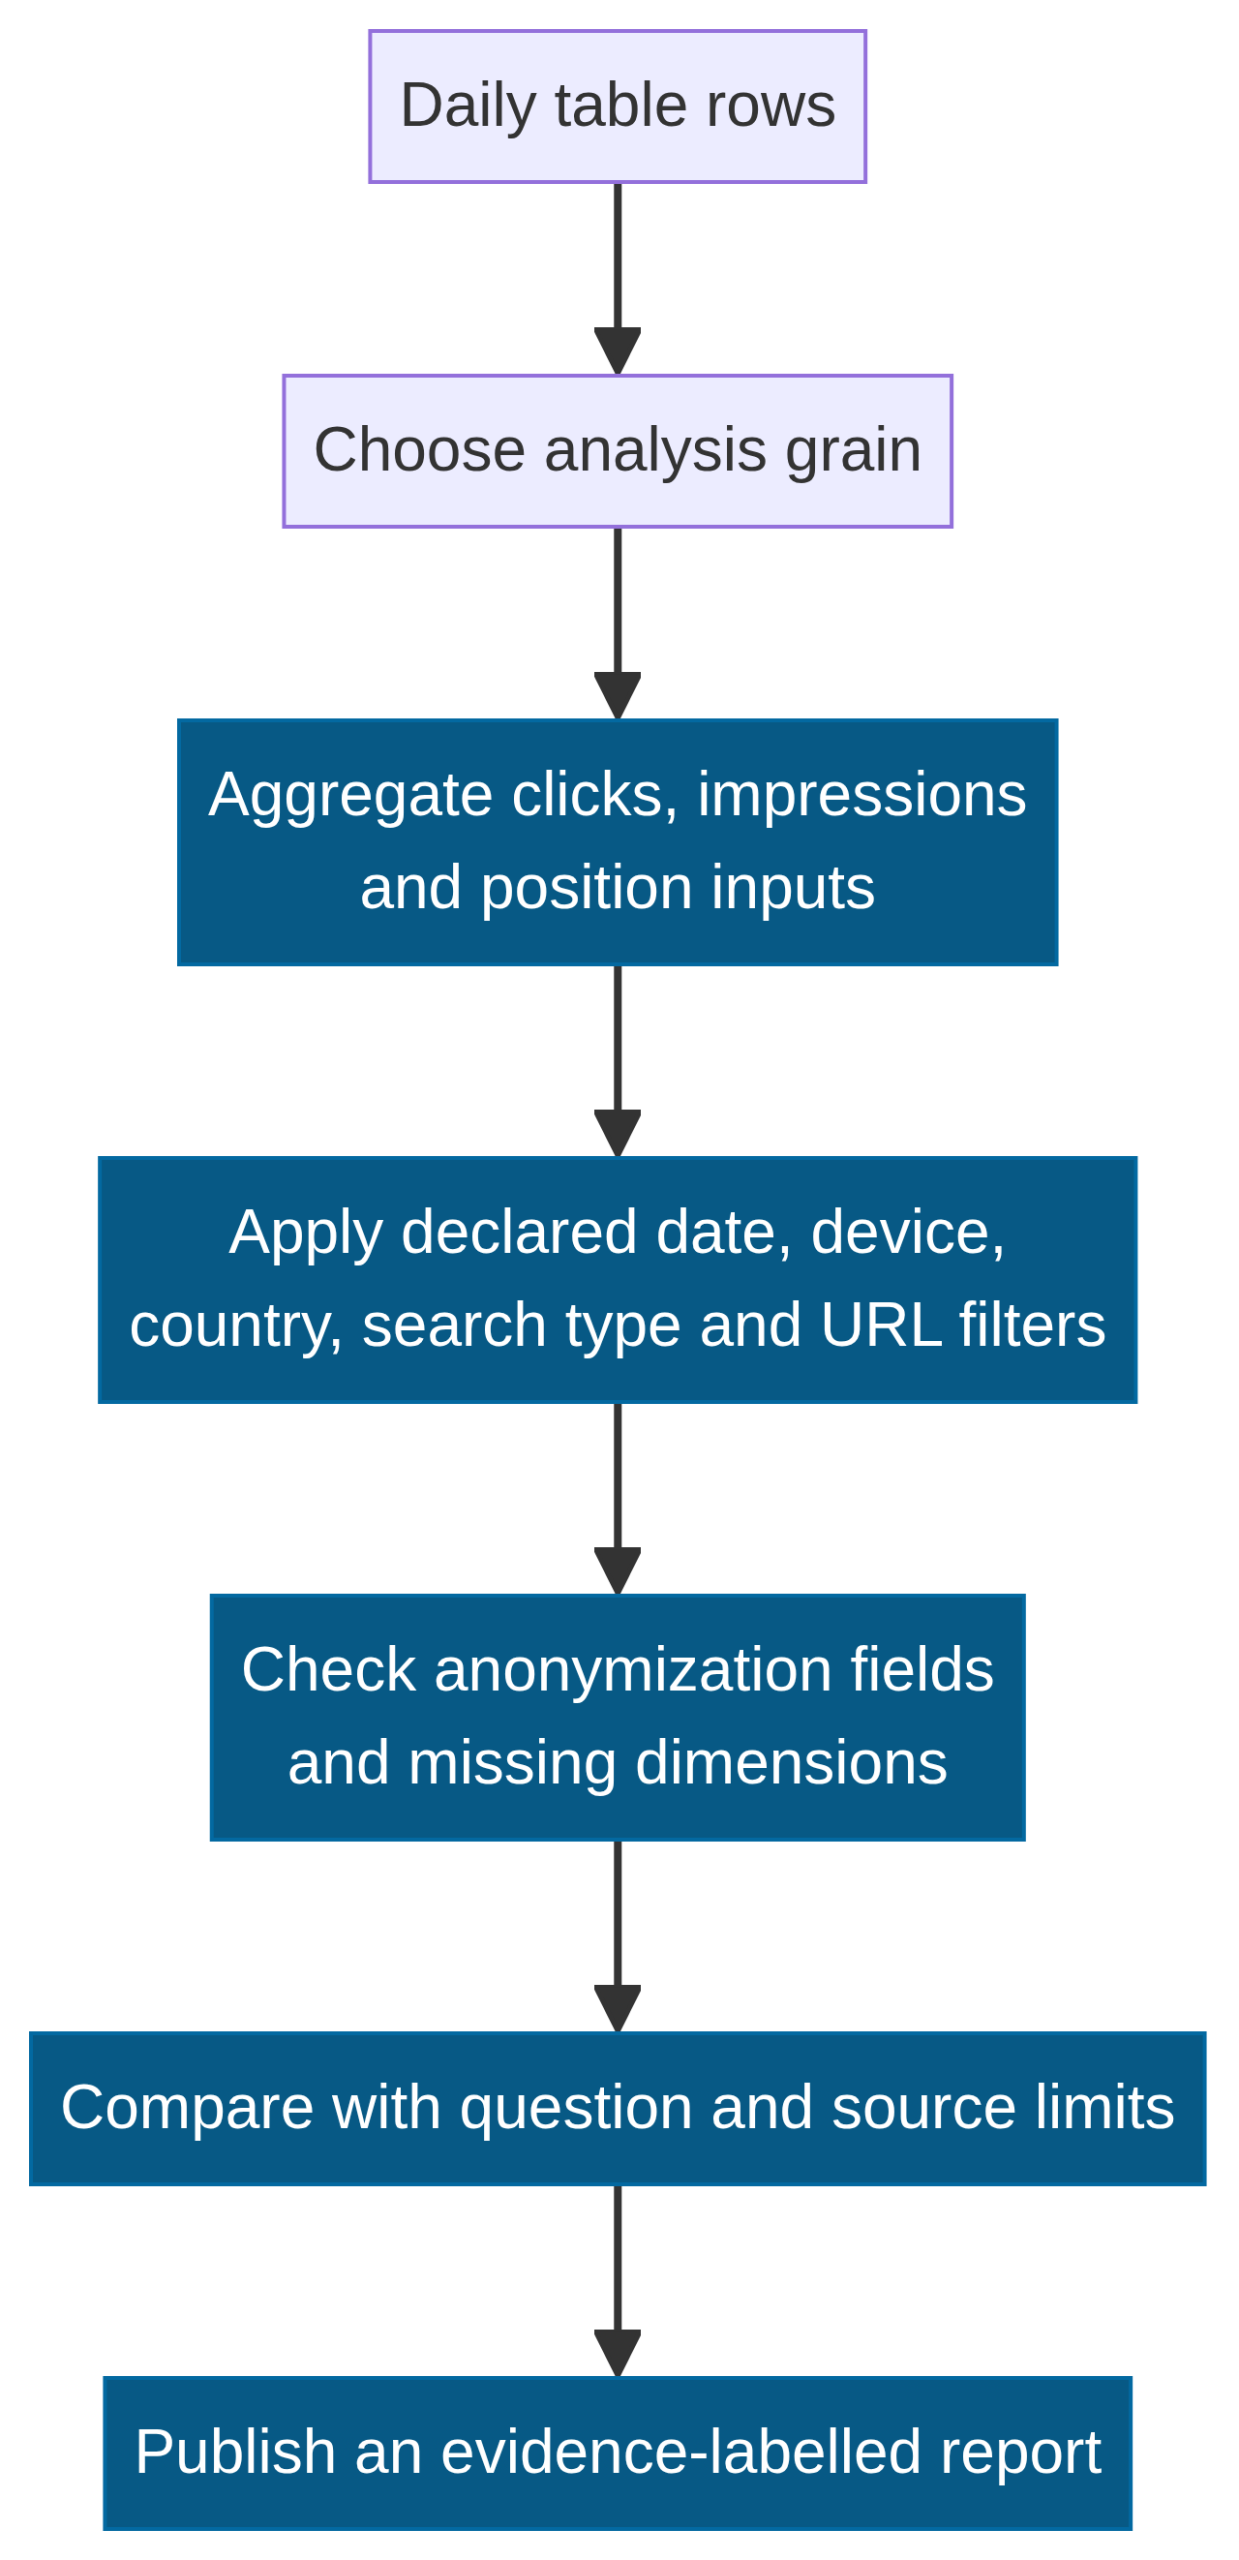
Search Console’s table guidance cautions that performance data is accumulated incrementally and that exported rows can have repeated keys. For most reporting questions, clicks, impressions, and position inputs should be aggregated at the selected reporting grain rather than read from one row as if it represented a complete total. [2] State the dimensions in the query: for example, date range, search type, country, device, URL, query, or appearance flag. Each added dimension changes what a row represents.
For an average-position calculation, Google documents using the sum of the applicable position field divided by total impressions, then adding one because the stored top position is zero-based. [2] Keep that formula beside the query or dashboard definition. Avoid calculating a simple average of daily averages, which can give small days equal weight with large days. Figure 4 summarizes the safer order: choose a grain, aggregate, apply declared filters, inspect privacy fields, then label the result with its source boundary.
Treat anonymization and missing dimensions as meaningful limits
Search Console protects user privacy through anonymization. In the documented tables, rare queries can be marked as anonymized and the query value is withheld. Some Discover records can also have anonymization thresholds that remove other dimensions. [2] A reporting process should treat these fields as part of the data model, not as defects to be filled with estimates. A total from visible query text is therefore a total for the retained query records under the selected table and filters, not a statement about every search performed by every user.
Describe privacy handling in plain language near any query chart or exported query list. The wording can be short: “This view uses available non-anonymized query records for the selected scope.” Do not attempt to reconstruct redacted terms or create a synthetic “other” label with invented detail. The absence of a visible query can reflect a privacy boundary, not evidence that no relevant search happened. Good reporting preserves that uncertainty instead of hiding it behind a precise-looking percentage.
Separate reporting data from a causal explanation
A line chart can show that the recorded measures differ between two periods. It cannot, on its own, establish why. Release dates, seasonality, tracking-definition changes, device mix, search type, data availability, content changes, and unrelated market events can all change the observed record. Treat an explanation as a hypothesis unless it is supported by additional evidence. This is especially important when an internal stakeholder wants a single cause for a change in a single metric.
Use a small evidence table when discussing a period comparison. Include the metric definition, data source, date range, filters, relevant site changes, external context that is actually documented, and open questions. This does not make every conclusion certain, but it separates observation from interpretation. A report that says “the URL-table measure changed after a documented release; the relationship needs further validation” is more useful than a confident narrative that cannot be reproduced.
Build reports around reproducible definitions
A reproducible export report has a named owner, written purpose, selected table, SQL or transformation version, date logic, filters, calculation definitions, and a clear destination. Maintain a short data dictionary that explains the internal names used in charts. Include whether the report is using property or URL data, which search type is included, and whether the ending date is complete. These fields often matter more than decorative dashboard design because they let the next analyst understand what the number represents.
Version the report definition when a new dimension, exclusion, or calculation is introduced. Do not silently overwrite a historical dashboard measure if the underlying question changes. An annual comparison may need a stable default date logic; a monitoring panel may need the latest fully available data date. Both can be valid if clearly named. The error is using the same label for different definitions and leaving stakeholders to assume that the series is directly comparable.
Choose filters before you compare periods
Search type, country, device, URL scope, and date are not cosmetic filters. They define the population represented by an export query. Fix them before comparing periods. If a report combines Web, Image, Video, News, Discover, or Google News records, say so and explain why. Google lists these search-type values in its table reference. [2] A view that changes the device or search-type filter between months is not a clean period comparison, even if both charts use the same colors and labels.
Use date boundaries that fit the decision. A completed weekly report can exclude the current partial day. A month-over-month review can use matching calendar periods. If data dates are stored in Pacific Time, align the narrative with that convention or explicitly explain a converted business time zone. Document the date condition in the query rather than relying only on a dashboard control. Saved definitions reduce accidental filter drift when someone reruns the analysis later.
Set a sensible retention and cost-control policy
Bulk export data accumulates in the Cloud project. Google recommends setting an appropriate partition-expiration period to manage storage and notes that the tables are retained indefinitely by default unless project or organization defaults intervene. [1] [2] Before configuration, decide how long the organization needs queryable records for the actual reporting purpose. A retention policy should be approved by the data owner, visible in the runbook, and reviewed when the report scope changes.
Google’s setup guidance says a partition expiration should be at least 14 days and cautions against changing the table schema, because schema changes can make exports fail. [1] Use partition-based controls rather than deleting a whole table merely to manage a month of data. Pair retention with simple query discipline: declare a partition/date range, avoid exploratory scans of every historical row when not needed, and keep heavyweight analysis separate from a routine monitoring dashboard. Cost governance is not about promising savings; it is about making usage intentional and inspectable.
Monitor the pipeline without turning a check into a promise
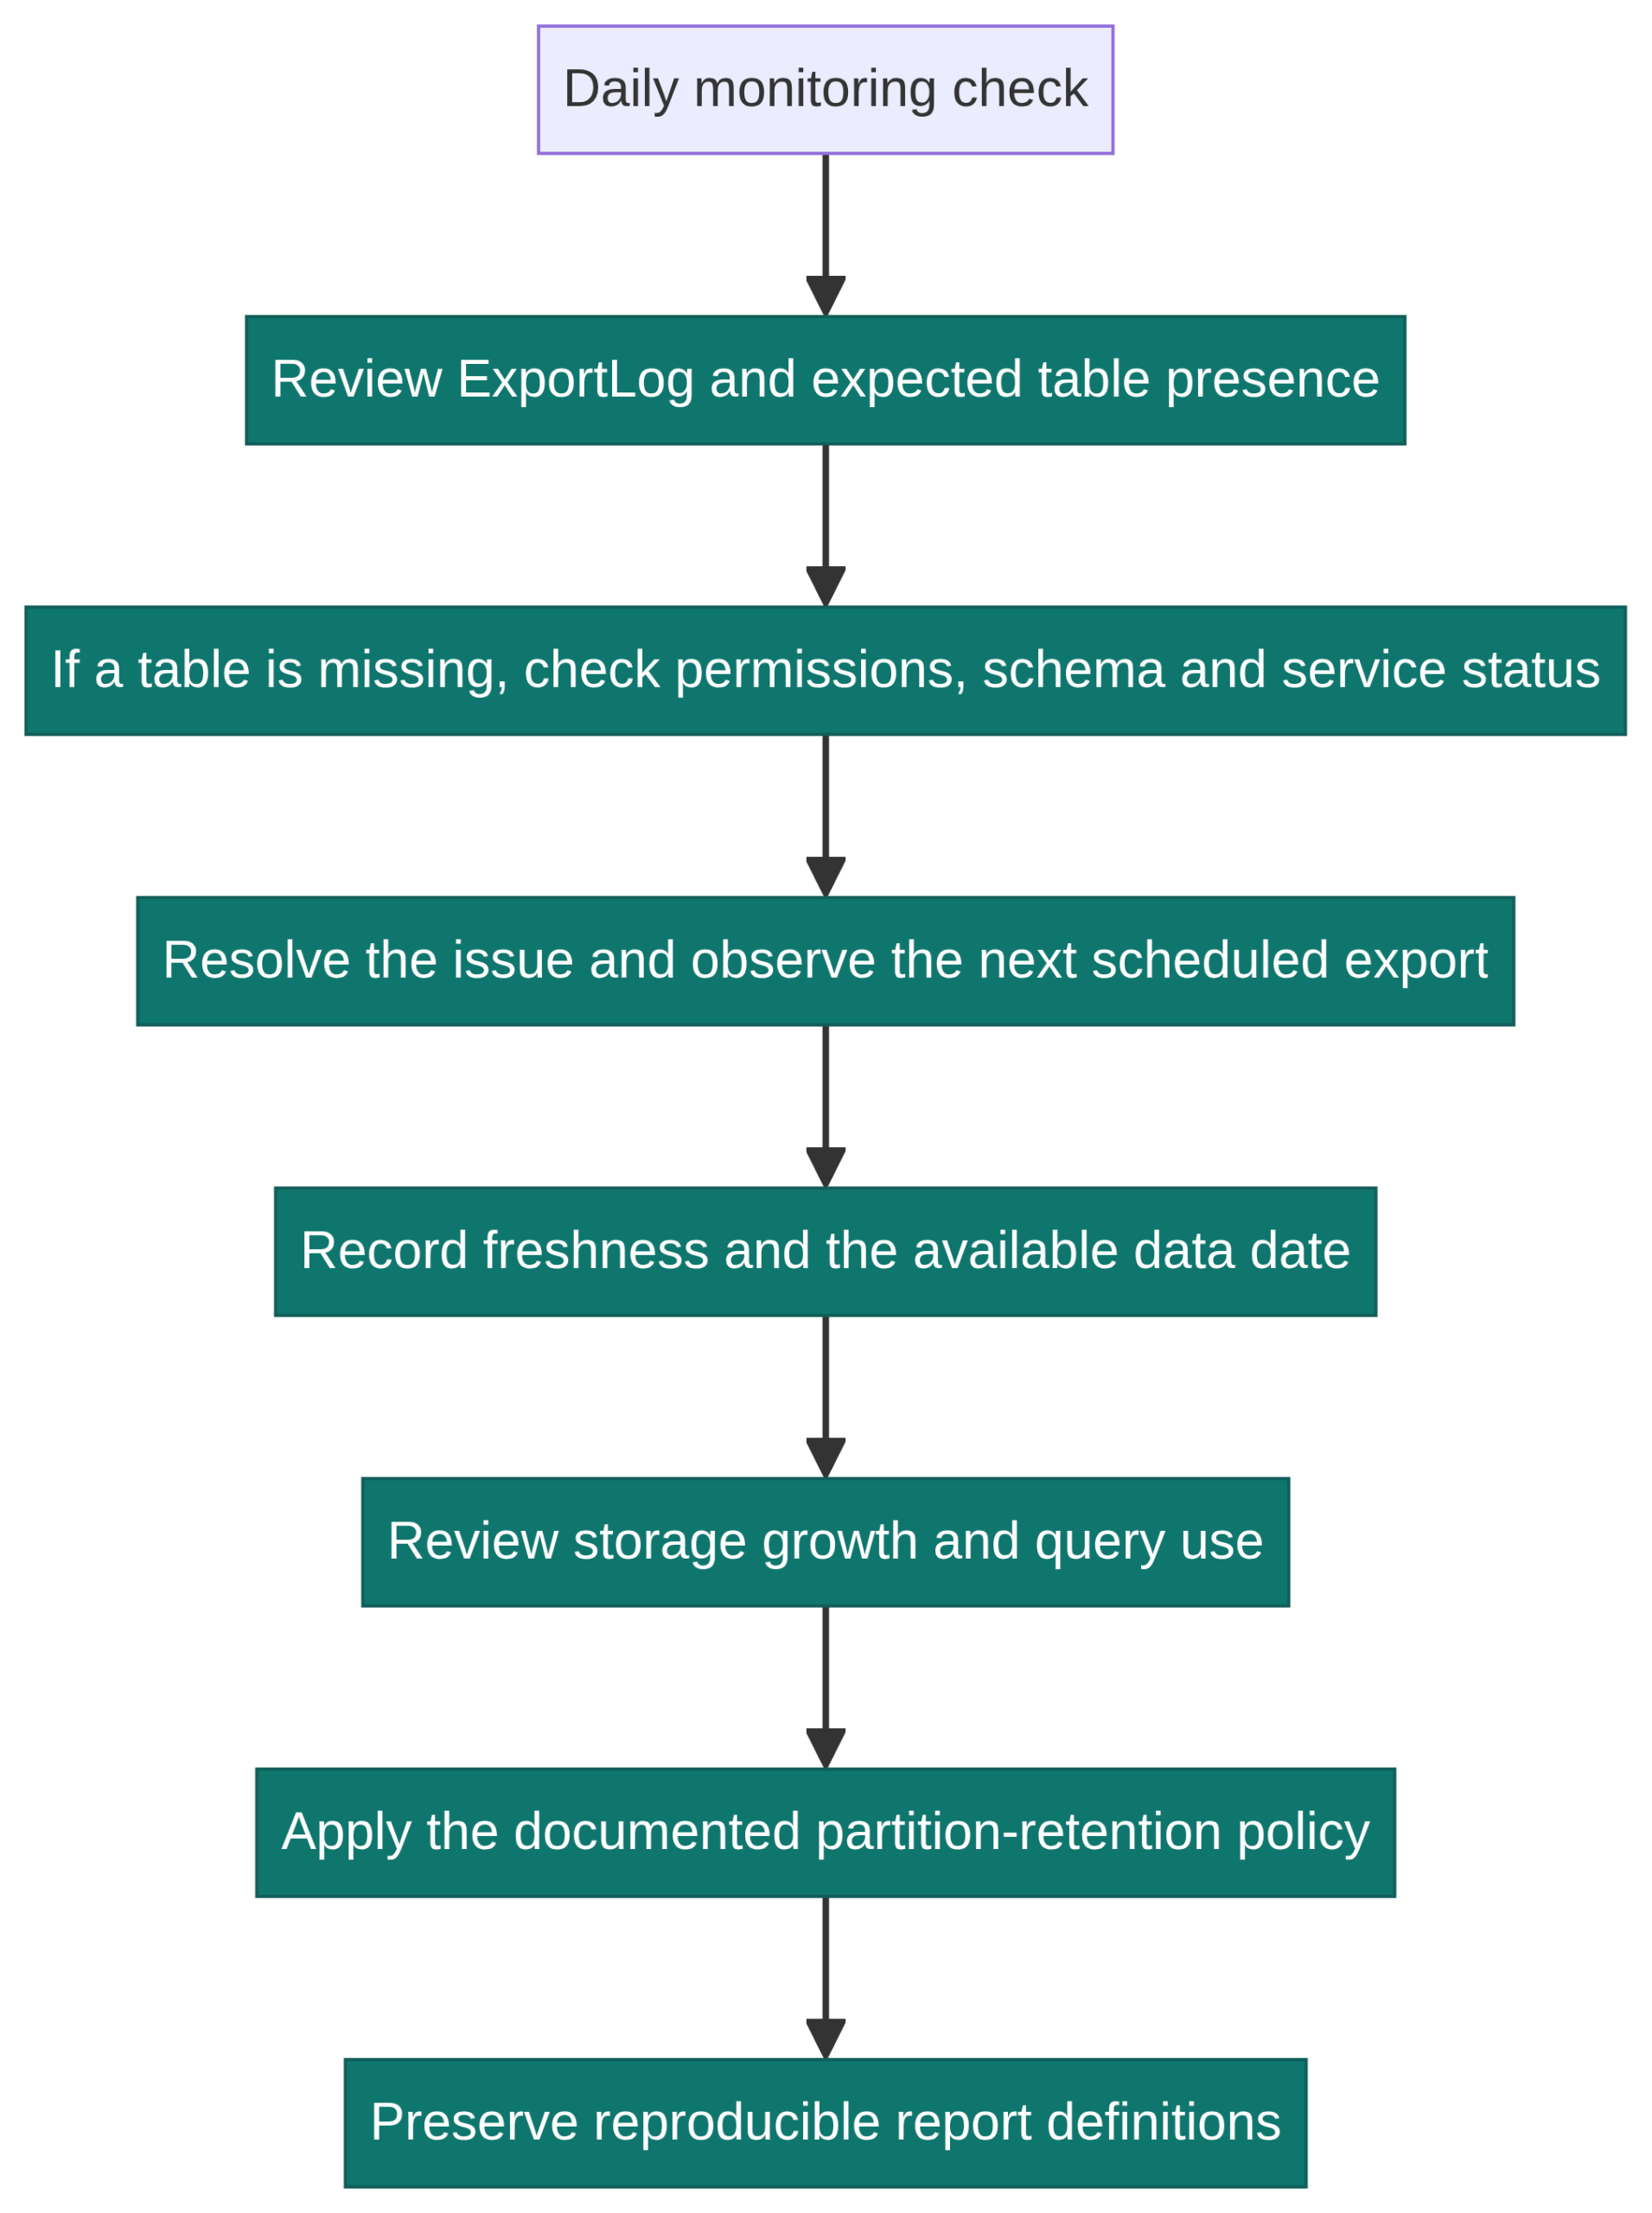
A brief daily or weekly check can review the latest ExportLog entries, expected table presence, latest data date, permissions changes, storage growth, and reports scheduled to run. Make the check proportionate. A small implementation may only need a shared checklist and a notification owner. A larger team may have a documented incident path and a governed dashboard. In either case, record what was observed rather than replacing missing evidence with a generic “all good” note.
When a table is absent, work from the documented possibilities: confirm that the export configuration still exists, review service-account roles, check whether anyone altered the table schema, and observe the next scheduled cycle after a correction. Google explains that successful export information appears in ExportLog, while unsuccessful attempts do not. [2] Figure 5 gives a compact operating sequence. It is a reporting-control model, not a claim that every gap can be diagnosed from the data alone.
Use an evidence-led SEO reporting workflow
An evidence-led workflow starts with a named question, checks the correct table and data date, aggregates rows using declared dimensions, and preserves both the query and the interpretation note. It then compares the observation with on-site facts such as a canonical URL inventory, a publication log, a redirect record, or a documented content change. Each source should retain its own timestamp and scope. This discipline prevents a single chart from becoming the sole evidence for a broad editorial or technical conclusion.
For a recurring content review, a team might map URL-level observations to a page inventory, flag pages needing a manual title, canonical, internal-link, or content-purpose review, and record the final human decision. The export can supply an organized observation layer. It cannot decide whether a page satisfies user needs, whether a redirect is equivalent, or whether a proposed edit is truthful. Keep the human review and the source evidence visible in the record.
Common mistakes to avoid
Common mistakes include selecting a Cloud location without ownership review, assuming old dates will appear after setup, treating URL and property records as identical, reading an individual incremental row as a total, averaging already-averaged positions, and overlooking anonymization fields. Another mistake is publishing a dashboard without its definitions. A number with no table, date range, dimensions, and formula is difficult to challenge and even harder to reuse responsibly.
Avoid presentation shortcuts that imply certainty. Do not call a partial period “monthly,” label a filtered query list “all queries,” or describe an ExportLog gap as a proven system failure. Do not claim that bulk data export improves visibility or causes a content result. Use specific, bounded language instead: “The daily URL-table records for the declared filter show…” or “The latest successful ExportLog entry available at the time of review was…”. Precision is both clearer and easier to audit.
A practical first-month checklist
In the first month, confirm the property and project owners, preserve the destination settings, check that both performance tables and ExportLog appear, record the first available data date, and write one small query for a narrowly defined question. Compare the output to a Search Console report only when the scope, date handling, and dimensions are made explicit. Store the query with its report title. This gives the team a foundation for later work without treating the first export as a finished analytics program.
At the end of the month, review access, retention, observed table freshness, and whether the original reporting question remains useful. Retire unused dashboards rather than letting undefined reports become institutional truth. If the scope expands, create a new versioned definition and obtain the appropriate data-governance review. This measured approach helps a team learn from the exported data while respecting the documented limits of Search Console performance information.
Final perspective
Search Console bulk data export is most useful when it is treated as durable reporting infrastructure with explicit definitions and operating controls. A correct setup is only the beginning. Teams still need to choose the appropriate table, aggregate data at the intended grain, acknowledge anonymization, record data availability, and keep their interpretations separate from what the records directly show. The aim is not to create a larger dashboard. The aim is to make relevant questions easier to reproduce and review.
If the reporting need is small, a simpler Search Console report or a one-time export may be the responsible choice. If a BigQuery export is appropriate, document ownership, permissions, location, table semantics, retention, and the first available date. That record lets the team use the data carefully without implying that an export connection itself determines what Google will do with a site.
Keep one evidence record beside each recurring report. It can contain the question, table, query version, selected dimensions, date range, calculation notes, data-date check, known exclusions, reviewer, and follow-up date. A short record reduces the risk that a useful exploratory view is later treated as a fixed business measure. It also gives an editor, analyst, or site owner a practical way to distinguish a direct observation from a proposed action. This control is deliberately modest: it improves traceability without claiming to resolve every ambiguity in search-performance data.